

As Asia’s markets navigate the complexities of rising energy costs and geopolitical uncertainties, investors are increasingly focused on identifying growth opportunities within the region. In this environment, companies with high insider ownership can be particularly attractive, as they often align management interests with those of shareholders and may demonstrate resilience amid fluctuating market conditions.
Top 10 Growth Companies With High Insider Ownership In Asia
| Name | Insider Ownership | Earnings Growth |
| Zhejiang Taotao Vehicles (SZSE:301345) | 27.5% | 31.5% |
| UTI (KOSDAQ:A179900) | 24.6% | 113.6% |
| SEERS (KOSDAQ:A458870) | 33.2% | 38.8% |
| Modetour Network (KOSDAQ:A080160) | 12.5% | 61.6% |
| Meitu (SEHK:1357) | 22.7% | 31.5% |
| Guangzhou Tinci Materials Technology (SZSE:002709) | 38.4% | 32.8% |
| Great Microwave Technology (SHSE:688270) | 21.1% | 71.6% |
| Gold Circuit Electronics (TWSE:2368) | 30.2% | 38.2% |
| Fulin Precision (SZSE:300432) | 10.4% | 61.6% |
| Fine M-TecLTD (KOSDAQ:A441270) | 15% | 98.4% |
Here’s a peek at a few of the choices from the screener.
Simply Wall St Growth Rating: ★★★★★☆
Overview: JST Group Corporation Limited, with a market cap of HK$6.89 billion, operates in China providing e-commerce Software as a Service (SaaS) through its subsidiaries.
Operations: The company generates revenue of CN¥1.14 billion from its Internet Software & Services segment.
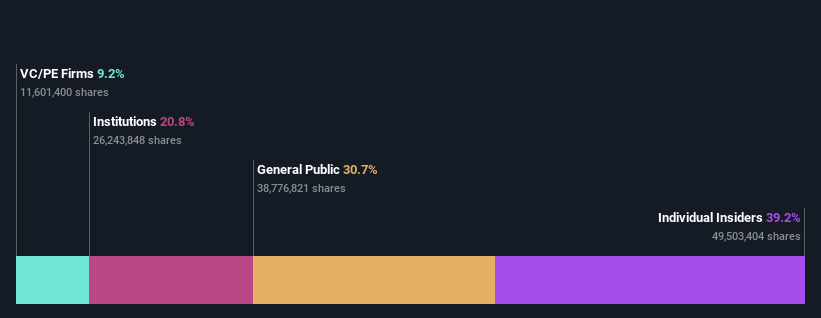
Insider Ownership: 39.2%
Return On Equity Forecast: 27% (2028 estimate)
JST Group’s recent share buyback program aims to enhance net asset value and earnings per share, reflecting strong insider confidence. Despite a challenging fiscal year with a significant net loss due to non-cash items related to convertible preferred shares, revenue grew by 25.6%. Analysts forecast JST will become profitable within three years with high return on equity and substantial profit growth. The stock trades at 64.7% below its estimated fair value, indicating potential upside.

Simply Wall St Growth Rating: ★★★★☆☆
Overview: Simplex Holdings, Inc. operates as an IT solutions provider in Japan with a market cap of ¥224.81 billion.
Operations: The company’s revenue segment is primarily derived from IT Solutions, amounting to ¥58.68 billion.
Insider Ownership: 32.8%
Return On Equity Forecast: 31% (2029 estimate)
Simplex Holdings’ recent earnings report shows robust growth with sales reaching ¥58.68 billion, up from ¥47.39 billion the previous year, and net income rising to ¥10.54 billion from ¥7.78 billion. The company is projected to outpace the Japanese market in both revenue and earnings growth at 13.9% and 15.2% annually, respectively, while trading at a discount of 27.2% below estimated fair value despite high share price volatility recently observed over three months.
Simply Wall St Growth Rating: ★★★★★☆
Overview: Sansan, Inc. is a company that plans, develops, and sells cloud-based solutions in Japan with a market cap of approximately ¥178.18 billion.
Operations: The company’s revenue is primarily derived from its Sansan/Bill One Business, which generated ¥44.70 billion, and the Eight Business, contributing ¥6.38 billion.
Insider Ownership: 39%
Return On Equity Forecast: 29% (2029 estimate)
Sansan’s earnings have grown 31.5% over the past year, with forecasts suggesting a significant annual growth of 34.98%, surpassing the Japanese market’s expected growth. Despite high share price volatility, it trades at a substantial discount to its estimated fair value. Recent events include an authorized buyback plan worth ¥2 billion to enhance shareholder returns and revised corporate guidance indicating increased net sales and operating profit expectations for the fiscal year ending May 2026.
Taking Advantage
This article by Simply Wall St is general in nature. We provide commentary based on historical data
and analyst forecasts only using an unbiased methodology and our articles are not intended to be financial advice. It does not constitute a recommendation to buy or sell any stock, and does not take account of your objectives, or your
financial situation. We aim to bring you long-term focused analysis driven by fundamental data.
Note that our analysis may not factor in the latest price-sensitive company announcements or qualitative material.
Simply Wall St has no position in any stocks mentioned.The analysis only considers stock directly held by insiders.
It does not include indirectly owned stock through other vehicles such as corporate and/or trust entities.
All forecast revenue and earnings growth rates quoted are in terms of annualised (per annum) growth rates over 1-3 years.
New: Manage All Your Stock Portfolios in One Place
We’ve created the ultimate portfolio companion for stock investors, and it’s free.
• Connect an unlimited number of Portfolios and see your total in one currency
• Be alerted to new Warning Signs or Risks via email or mobile
• Track the Fair Value of your stocks
Have feedback on this article? Concerned about the content? Get in touch with us directly. Alternatively, email editorial-team@simplywallst.com