

In recent weeks, global markets have experienced a mix of volatility and resilience, with major indices like the Nasdaq Composite and S&P 500 facing declines due to pressures on large-cap tech stocks, while sectors such as energy have seen gains amid geopolitical tensions. Amid these fluctuations, investors are increasingly focusing on growth companies with high insider ownership—an indicator that can signal confidence in a company’s potential for sustained earnings growth even in uncertain market conditions.
Top 10 Growth Companies With High Insider Ownership Globally
| Name | Insider Ownership | Earnings Growth |
| Suzhou Dongshan Precision Manufacturing (SZSE:002384) | 33.5% | 73.1% |
| Shanghai Biren Technology (SEHK:6082) | 11% | 116.9% |
| Seojin SystemLtd (KOSDAQ:A178320) | 22% | 110.6% |
| SEERS (KOSDAQ:A458870) | 33.2% | 41.5% |
| Meitu (SEHK:1357) | 22.8% | 31.3% |
| Meiko Electronics (TSE:6787) | 19.2% | 28.0% |
| HUMAN MADE (TSE:456A) | 23.9% | 23.4% |
| Great Microwave Technology (SHSE:688270) | 29.5% | 85.5% |
| Gold Circuit Electronics (TWSE:2368) | 30.1% | 38.2% |
| Biocytogen Pharmaceuticals (Beijing) (SEHK:2315) | 14.1% | 40.4% |
Let’s dive into some prime choices out of the screener.
Simply Wall St Growth Rating: ★★★★★★
Overview: Ningbo Deye Technology Group Co., Ltd. operates in China, focusing on solar inverter systems, frequency conversion control systems, environmental electrical appliances, and heat exchangers, with a market cap of approximately CN¥102.44 billion.
Operations: The company generates revenue through its operations in solar inverter systems, frequency conversion control systems, environmental electrical appliances, and heat exchangers.
Insider Ownership: 23%
Earnings Growth Forecast: 26.8% p.a.
Ningbo Deye Technology Group exhibits strong growth potential, with revenue expected to grow 26.6% annually, outpacing the Chinese market’s 16.1%. Its earnings are projected to increase significantly at 26.8% per year, surpassing market expectations. Recent financial results highlight robust performance with a net income of CNY 1.19 billion for Q1 2026, up from CNY 705.54 million a year prior. The stock trades at a discount of approximately 30%, suggesting potential upside according to analysts’ price targets.

Simply Wall St Growth Rating: ★★★★★★
Overview: Sieyuan Electric Co., Ltd. is involved in the design, research and development, manufacturing, sale, service, and EPC of power transmission and distribution equipment both in China and internationally with a market cap of CN¥120.73 billion.
Operations: The company’s revenue from the Transmission and Distribution Equipment Industry is CN¥23.85 billion.
Insider Ownership: 35%
Earnings Growth Forecast: 30.1% p.a.
Sieyuan Electric demonstrates strong growth characteristics, with revenue anticipated to rise by 26% annually, exceeding the Chinese market’s average. Its earnings are forecasted to grow significantly at 30.1% per year. Recent results show a net income increase to CNY 1.49 billion for H1 2026 from CNY 1.29 billion the previous year, reflecting its robust performance and potential upside as analysts agree on a price rise of around 32%.
Simply Wall St Growth Rating: ★★★★★☆
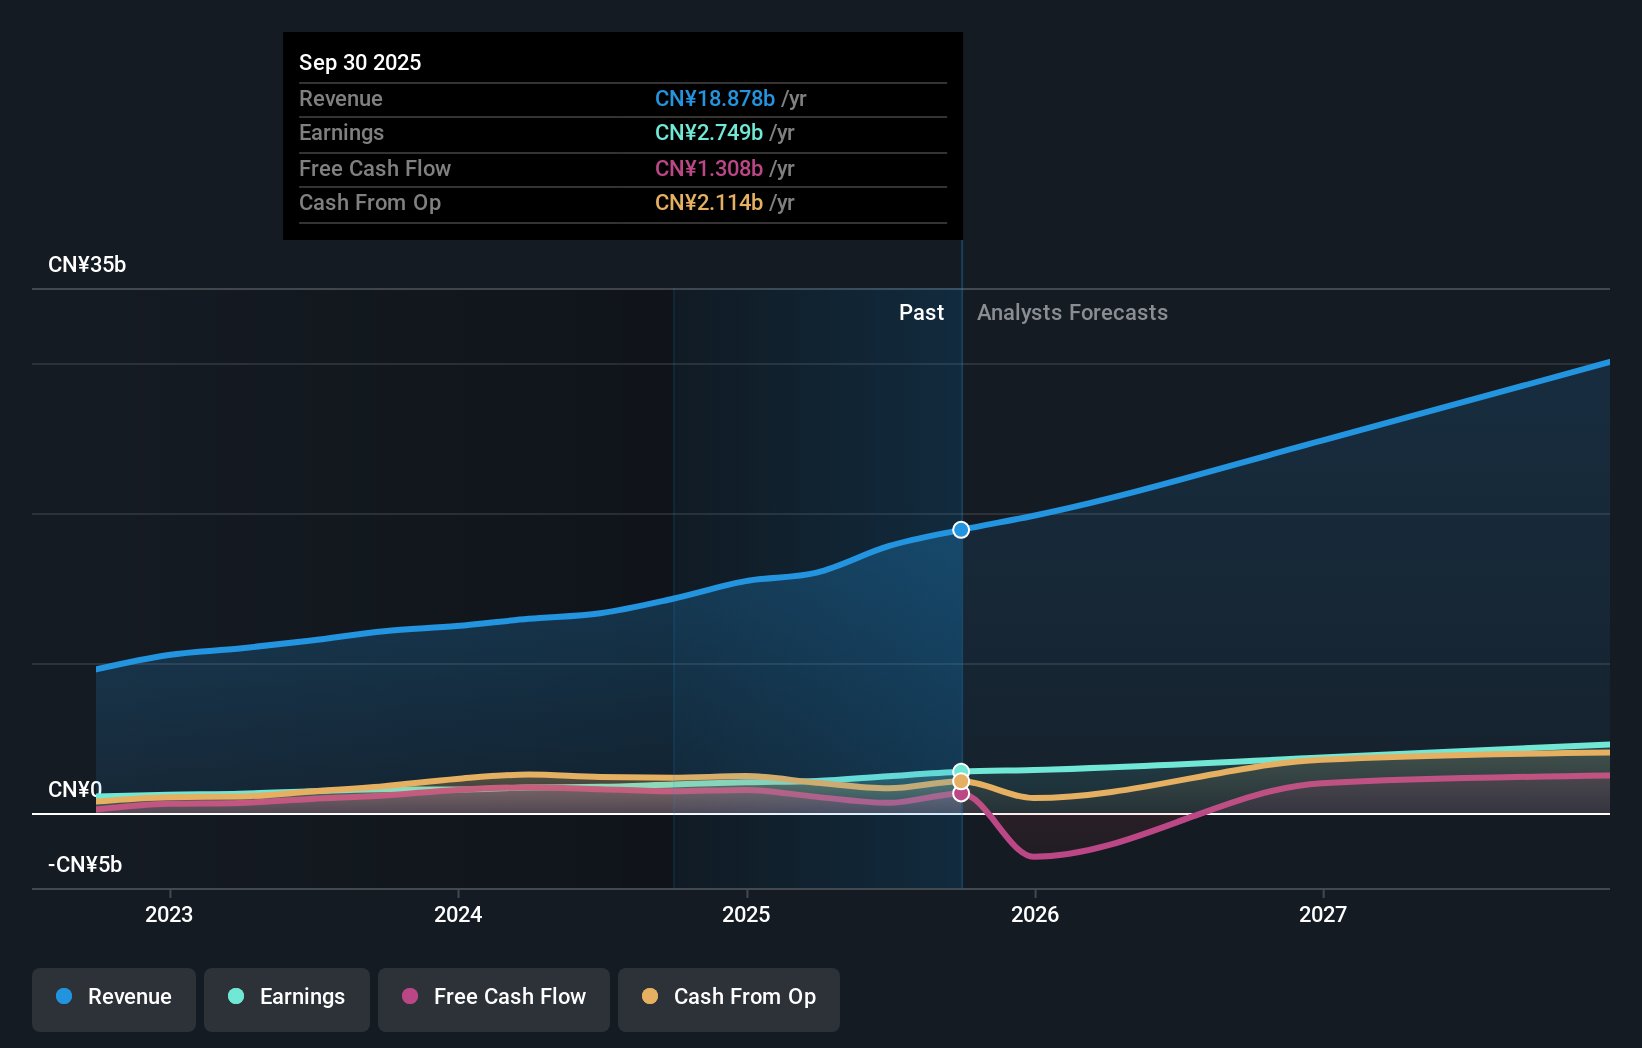
Overview: Ganfeng Lithium Group Co., Ltd. is a Chinese company that manufactures and sells lithium products, with a market cap of approximately CN¥91.29 billion.
Operations: Ganfeng Lithium Group Co., Ltd. generates revenue through the manufacturing and sale of lithium products in China.
Insider Ownership: 26.7%
Earnings Growth Forecast: 34.4% p.a.
Ganfeng Lithium Group’s earnings are projected to grow significantly at 34.41% annually, outpacing the Chinese market. Recent guidance indicates a substantial profit increase for H1 2026, driven by higher lithium salt prices and increased battery segment sales. Despite trading below estimated fair value, its debt coverage is weak. The company also benefits from investment income through asset optimization and strategic disposals, enhancing financial performance without recent insider trading activity impacting ownership dynamics.
Where To Now?
This article by Simply Wall St is general in nature. We provide commentary based on historical data
and analyst forecasts only using an unbiased methodology and our articles are not intended to be financial advice. It does not constitute a recommendation to buy or sell any stock, and does not take account of your objectives, or your
financial situation. We aim to bring you long-term focused analysis driven by fundamental data.
Note that our analysis may not factor in the latest price-sensitive company announcements or qualitative material.
Simply Wall St has no position in any stocks mentioned.The analysis only considers stock directly held by insiders.
It does not include indirectly owned stock through other vehicles such as corporate and/or trust entities.
All forecast revenue and earnings growth rates quoted are in terms of annualised (per annum) growth rates over 1-3 years.
New: Manage All Your Stock Portfolios in One Place
We’ve created the ultimate portfolio companion for stock investors, and it’s free.
• Connect an unlimited number of Portfolios and see your total in one currency
• Be alerted to new Warning Signs or Risks via email or mobile
• Track the Fair Value of your stocks
Have feedback on this article? Concerned about the content? Get in touch with us directly. Alternatively, email editorial-team@simplywallst.com