A quarter of crosswinds and confirmation
The third quarter of 2025 opens with commodity markets caught between opposing forces—technical setups signaling potential breakout conditions, and macro fundamentals still searching for clarity. As the dust settles from Q2’s geopolitical shifts and tariff announcements, the focus pivots to real demand, inflation signals, and central bank action.
In this outlook, we analyse four key commodities—gold, silver, copper, and oil—through the lens of technical structure and macro reasoning. We also incorporate two important inter-commodity ratios that offer deep insight into market psychology, growth dynamics, and inflation trends.
Let’s begin.
Gold: Coiling for a breakout amid macro caution
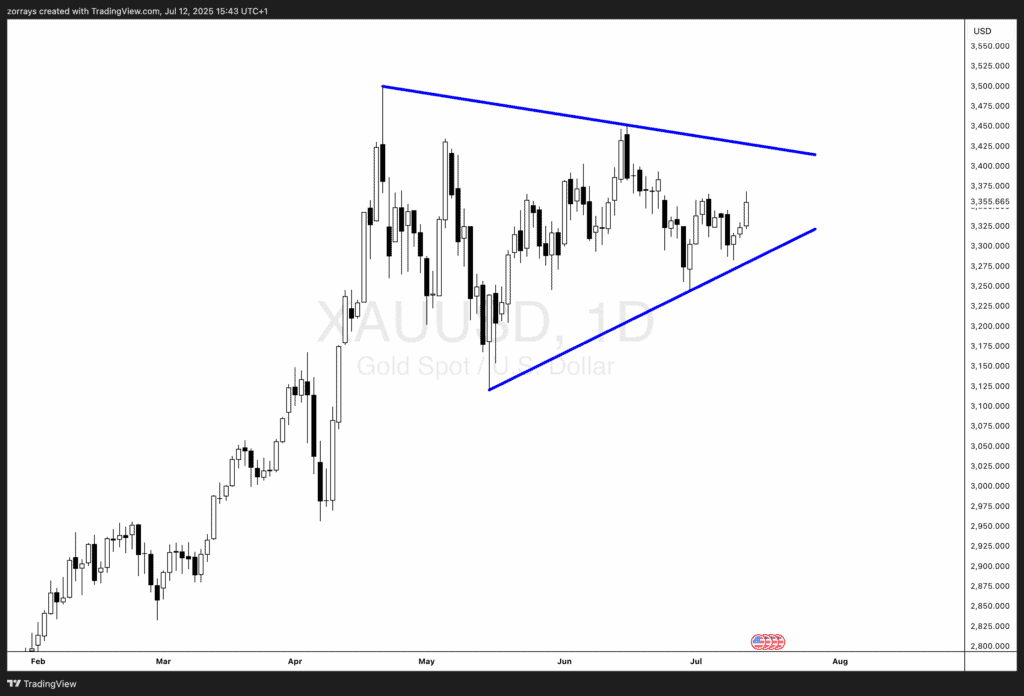
Gold has been consolidating in a symmetrical triangle on the daily chart, squeezing between ascending support and descending resistance. The current structure reflects an increasingly neutral market tone, but this kind of price compression typically leads to strong directional moves.
Why this triangle matters
Fundamentally, gold is caught between two macro narratives:
-
Supportive factors include stubborn core inflation, cautious central banks, and slower U.S. job growth—all encouraging safe-haven flows.
-
Pressure comes from fading geopolitical risk and marginal dollar strength, which can sap near-term bullish energy.
A clean break to the upside would align with renewed market anxiety—whether over inflation surprise, a weaker U.S. dollar, or dovish central bank pivots. A downside break would likely reflect rising optimism in the growth story, rotating capital toward risk assets and industrial metals.
Conclusion: Watch this structure closely. A breakout confirms gold’s next leg in the current bullish trend. A breakdown says the market prefers growth over protection.
Silver: Riding the channel toward $42
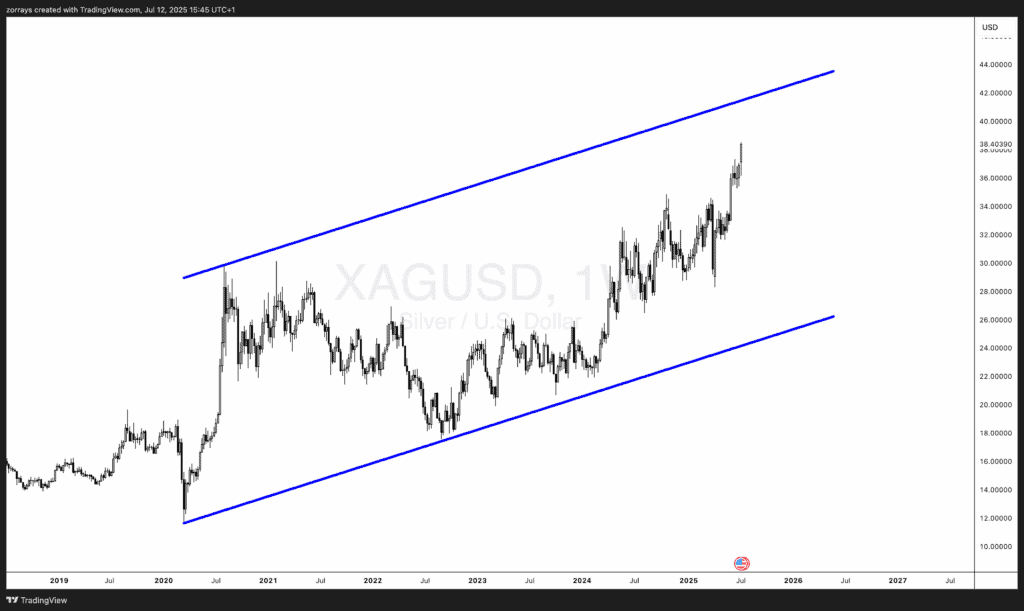
Silver continues to march higher within a long-standing ascending channel. After bouncing cleanly off the lower bound earlier this year, price is now targeting the upper boundary around $42.
Why Silver has momentum
Unlike gold, silver is part industrial, part monetary—and both sides are currently supportive:
-
Industrial demand is rising thanks to solar, semiconductors, and clean tech.
-
Inflation hedge appeal remains intact, especially as it trades at a discount to gold.
If silver reaches the $42 level and breaks through, it would confirm strong economic optimism and global manufacturing resilience. Even if it stalls there, the trend remains intact, reinforcing the broader reflation narrative.
Conclusion: Silver is a momentum story this quarter—with both macro and technical conditions aligned for further upside.
Copper: Price spike feels stretched
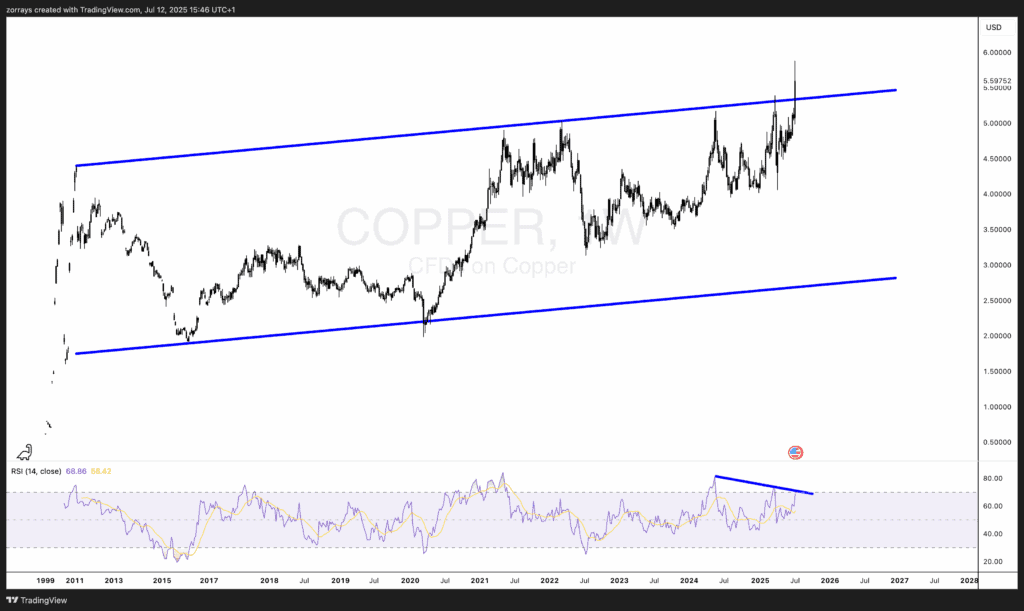
Copper made headlines in Q2 after surging to all-time highs, briefly overshooting its decade-long ascending channel. However, this move has been accompanied by a bearish RSI divergence, raising doubts about the sustainability of the rally.
Why did Copper explode?
The spike was largely driven by:
-
Tariff speculation—U.S. plans for a 50% tariff on Chinese copper imports (effective August 1st) led to front-loaded buying.
-
Supply bottlenecks and low inventories created additional upward pressure.
But here’s the concern: these are short-term distortions, not sustained demand signals. If global manufacturing data softens or substitution kicks in, copper could retrace back into its channel.
Conclusion: Caution is warranted. Unless a structural shift in demand follows, copper’s current levels may not hold. The RSI divergence is a warning to bulls that the rally could fade.
US Oil (WTI): Bottoming or Just bouncing?
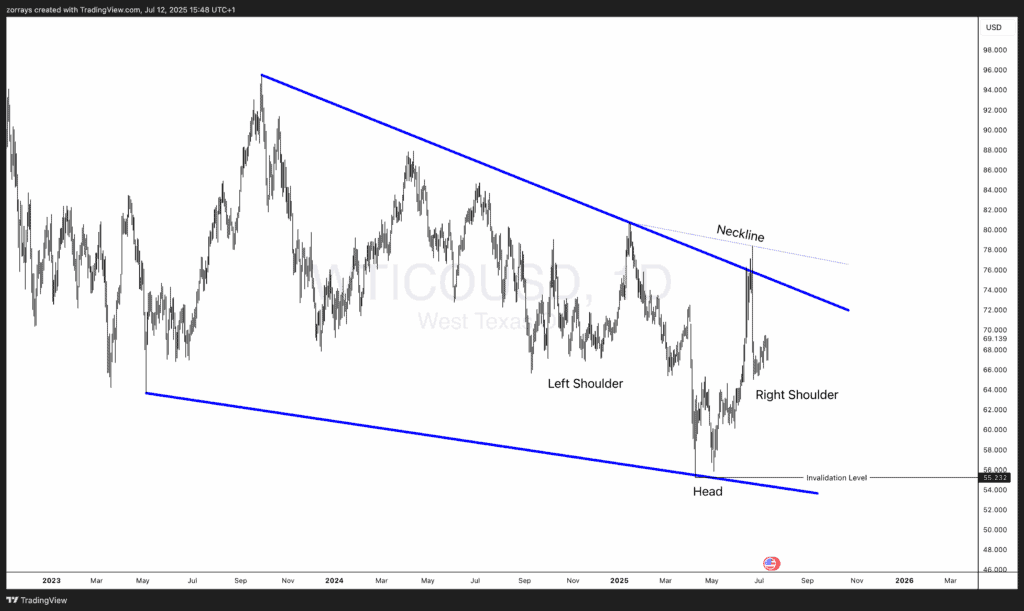
WTI crude oil has built a compelling inverse head and shoulders pattern, with the right shoulder now forming after a rebound from $55.23—its key invalidation level.
What changed in Oil markets?
-
Middle East tensions have faded, with the Iran-Israel ceasefire removing short-term geopolitical premiums.
-
Now, oil is trading on macro data—U.S. employment, GDP, global PMIs, and China’s industrial production will be key.
The chart setup is constructive, but the right shoulder is incomplete. To validate the pattern, we need:
Conclusion: As long as oil stays above the $55 region, Q3 could see the right shoulder develop and complete a longer-term bullish reversal.
Macro ratios worth watching
1. Gold/Silver ratio: Favouring reflation?
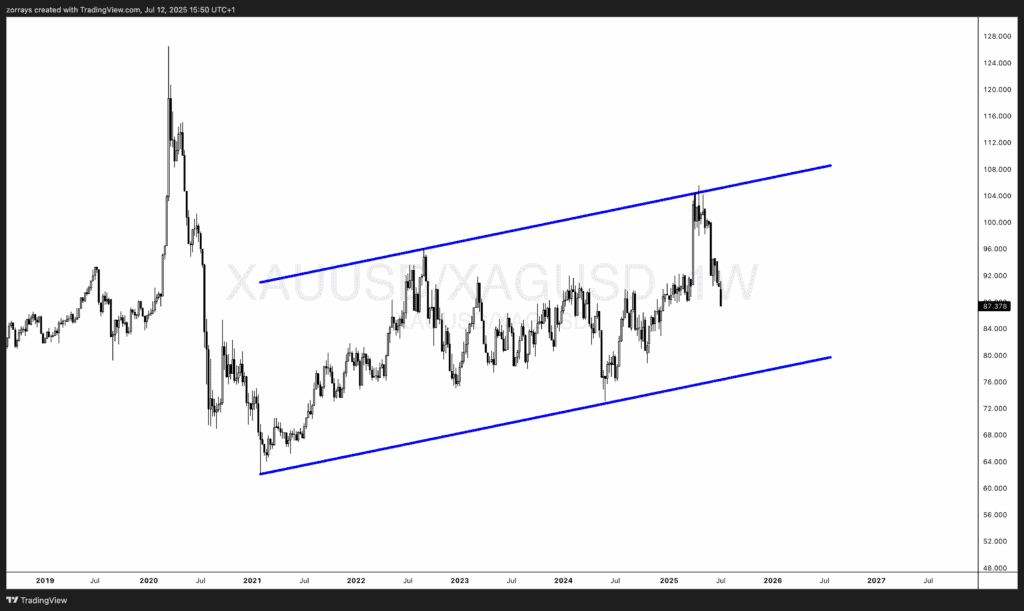
The gold/silver ratio has been declining steadily inside a rising channel—a meaningful structural behaviour that reflects silver’s outperformance.
What this means
-
A falling ratio suggests markets are shifting away from fear (gold) and embracing growth optimism (silver).
-
If this decline continues, it would be a strong reflationary signal—often preceding stronger manufacturing growth and rising wage pressures.
Conclusion: This ratio is a quiet indicator of how risk sentiment is evolving beneath the surface of broader markets.
2. US Oil/Copper ratio: The growth vs cost tug-of-war
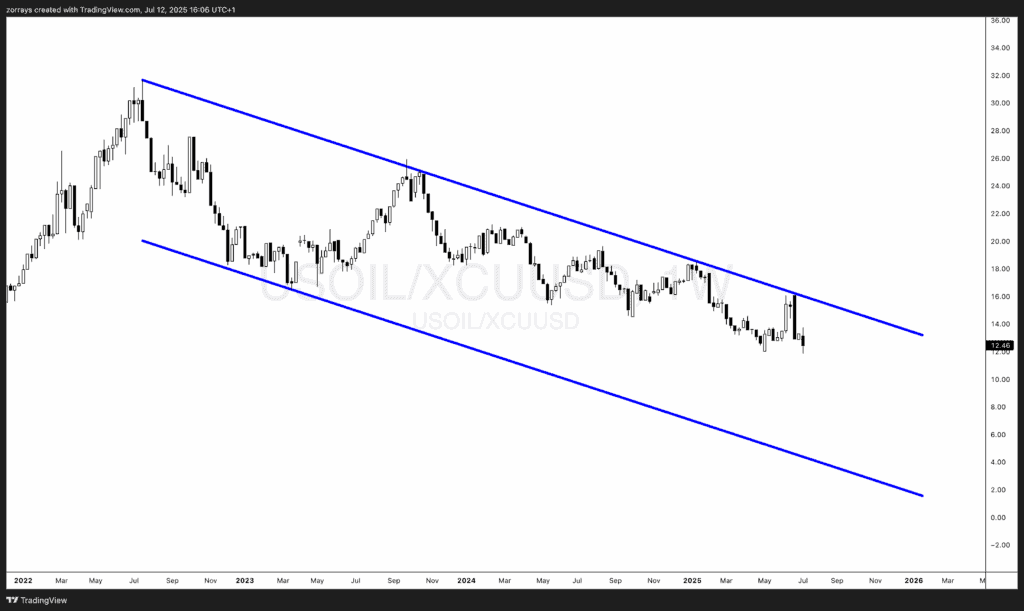
The oil-to-copper ratio is stuck near a descending trendline. This is where fundamentals and price action collide.
If It Breaks Higher
Energy prices rising faster than copper could signal stagflation risks, or squeezed corporate margins—especially in energy-intensive sectors.
If It Reverses Lower
- Copper outperforming oil suggests stronger industrial activity with controlled input costs. This is the ideal reflation scenario: rising growth without excess inflation.
Given copper’s recent strength and oil’s hesitancy, a falling ratio could imply global growth is returning, but without the kind of commodity-led inflation that worries central banks.
Conclusion: This ratio offers a rare, clean read on the economy’s balance between productive expansion and inflationary strain.
Quarterly summary table
| Commodity | Technical Setup | Fundamental Catalyst | Q3 Outlook |
| Gold | Symmetrical triangle | Inflation risk, Fed stance | Poised for breakout direction |
| Silver | Ascending channel, near resistance | Industrial demand, monetary tailwinds | Targeting $42 |
| Copper | Channel overshoot, RSI diverging | Tariffs, supply squeeze | Cautiously bearish |
| WTI Oil | Inverse H&S setup | Macro data focus post-ceasefire | Watch neckline, $55 key support |
Final thoughts
Q3 2025 will be defined not just by price—but by how markets interpret price in the context of growth, inflation, and central bank strategy. The technicals are offering clues, but it’s the interplay of fundamentals and expectations that will determine what breaks and what holds.
By watching both commodities individually and in relation to each other, we can get a cleaner read on where the macro winds are truly blowing.