Basic physicochemical properties and heavy metal content characteristics of rhizosphere soil and wheat grain
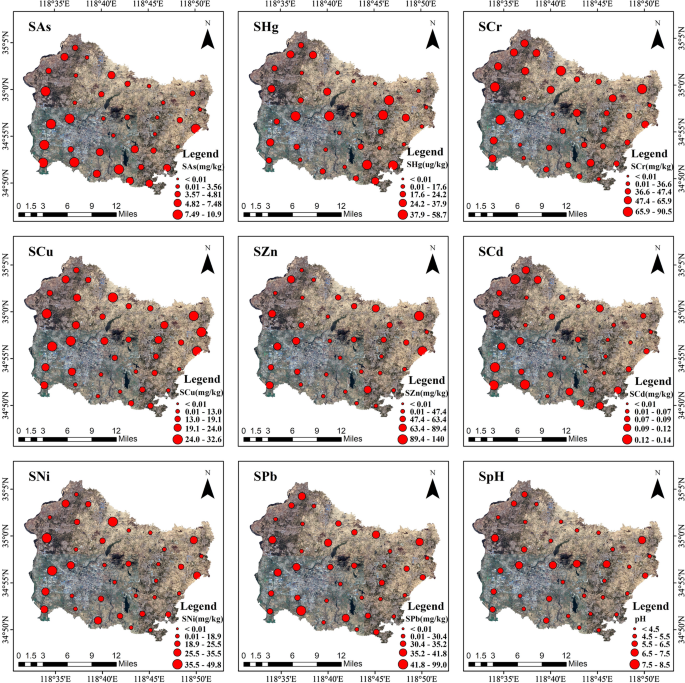
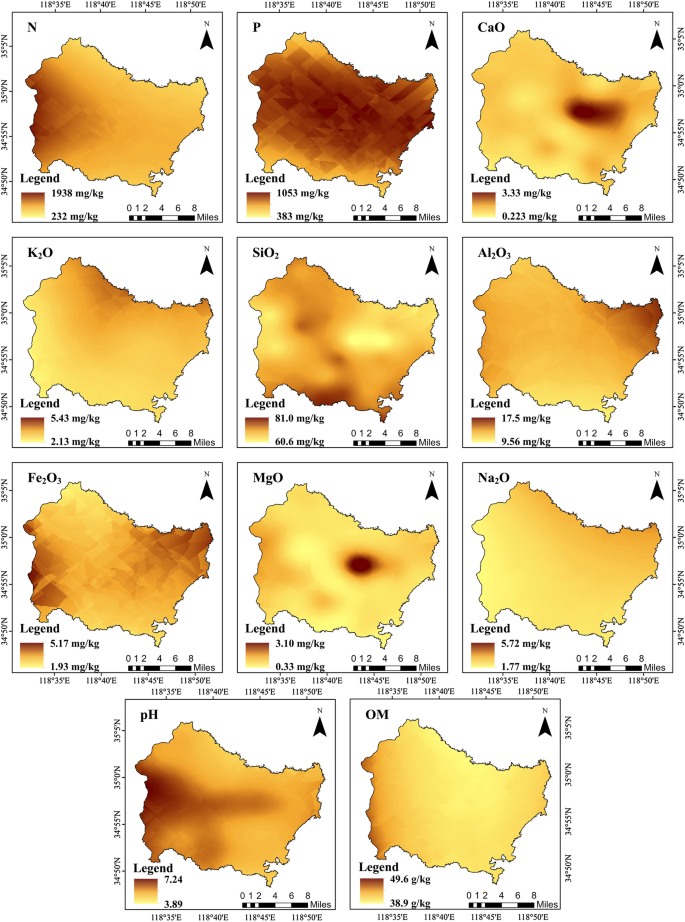
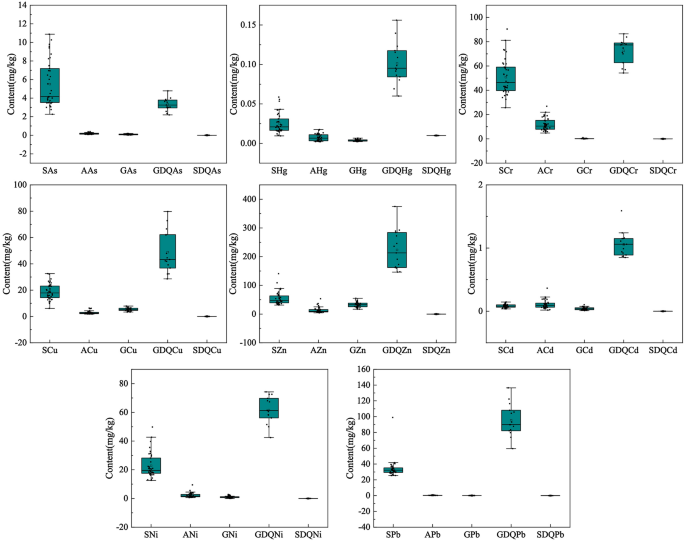
Statistical information of soil parameters and heavy metal concentrations of the wheat rhizosphere soil in the study area is shown in Tables 2 and 3. Among these, Zn exhibited the highest average content, while Hg displayed the lowest. The variation coefficient of heavy metals in descending order was Hg > As > Zn > Ni > Cd > Cu > Pb > Cr, ranging from 30 to 50%, indicating some differences in the distribution of soil heavy metal in the region, Fig. 3 further supports this observation. The soil pH in the study area exhibited a range of 4.75 to 7.46, with higher values observed in the western and central regions (Fig. 4). The average pH was determined to be 5.63, accompanied by a coefficient of variation of 13.02%. These findings collectively indicate that the soil within the investigated area predominantly displayed acidic characteristics. The OM content ranged between 6.00 × 10⁴ mg/kg and 36.5 × 10⁴ mg/kg, with an average of 16.9 × 10⁴ mg/kg, and the coefficient of variation was 37.9%, indicating that OM distribution in the region varied to a certain extent (Table 3). The highest concentration of soil OM is observed in the western region of the study area, while the lowest concentration is found in the eastern part near the center (Fig. 4). The variation coefficient of soil parameters in descending order was MgO > CaO > N > OM > P > Fe2O3 > K2O > Na2O > pH > Al2O3 > SiO2. Combined with the distribution map of soil parameters (Fig. 4), we can generally see that there are some differences in the spatial distribution of soil parameters.
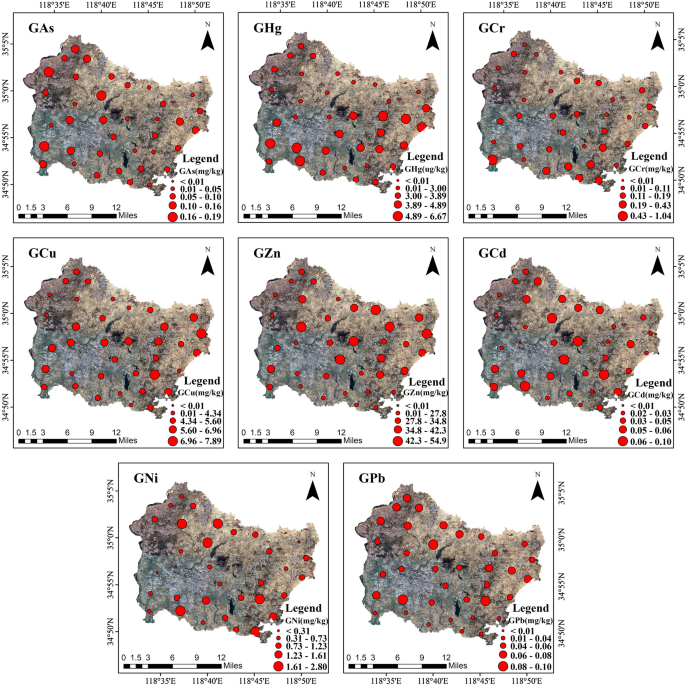
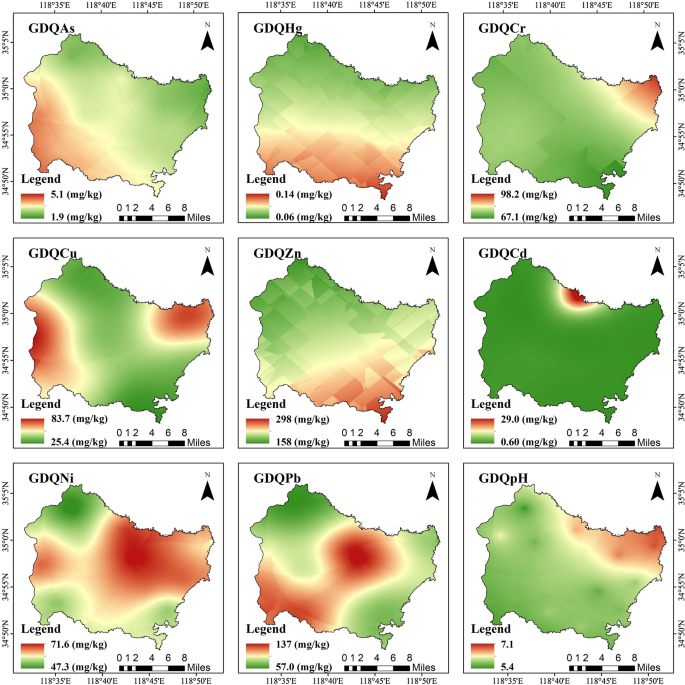
Table 2 displays the statistical analysis results of the heavy metal concentrations in wheat grain in the study area. Overall, Cu and Zn exhibited higher levels compared to other heavy metals, with concentrations of 5.33 mg/kg and 33.1 mg/kg, respectively. The content of Cu and Zn in wheat grains were similar in spatial distribution, which were higher in the middle and northeast, and lower in the northwest and southeast (Fig. 5). The average levels for Ni, Cr, As, Pb, Cd, and Hg were 1.06 mg/kg, 0.19 mg/kg, 0.09 mg/kg, 0.06 mg/kg, 0.042 mg/kg, and 0.004 mg/kg, respectively. In terms of spatial distribution patterns observed for these elements: As and Pb demonstrated a comparable trend with high values observed in the northwest region but low values found in the southeast; similarly, Hg and Cr showed a consistent pattern with high values detected in the southeast region but low values identified in the northwest region. Ni was lower in the middle and higher in the northwest and southeast. Ca is lower in the east and west, higher in the middle and north and south.
Additionally, Fig. 6 displays the distribution of the heavy metal concentrations in wheat roots, stems, leaves in the study area, except for Hg and Pb, the contents of heavy metals in wheat roots, stems and leaves showed similar distribution characteristics with those in wheat grains. Conversely, there is an inverse spatial distribution pattern for Hg and Pb between wheat roots, stems, leaves, and grains. The average Hg, As, Cr, Ni, Cu, Zn, Cd, and Pb content in wheat roots, stems, and leaves were 0.202 mg/kg, 0.176 mg/kg, 12.0 mg/kg, 2.21 mg/kg, 2.89 mg/kg, 13.7 mg/kg, 0.109 mg/kg, and 0.371 mg/kg (Table 2). These results indicate significant differences in the distribution of heavy metals in roots, stems, leaves, and wheat grain, which can limit the internal transport of wheat27.
Characteristics of heavy metal content and in atmospheric dry and wet deposition
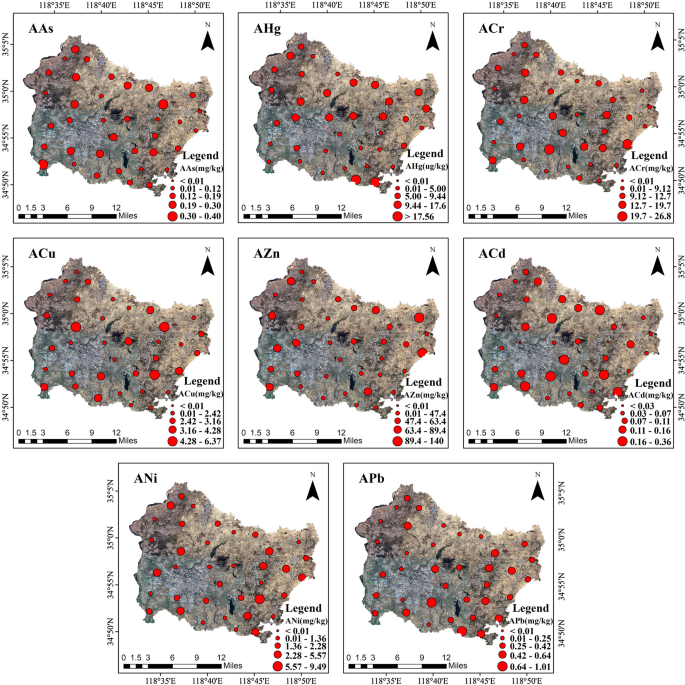
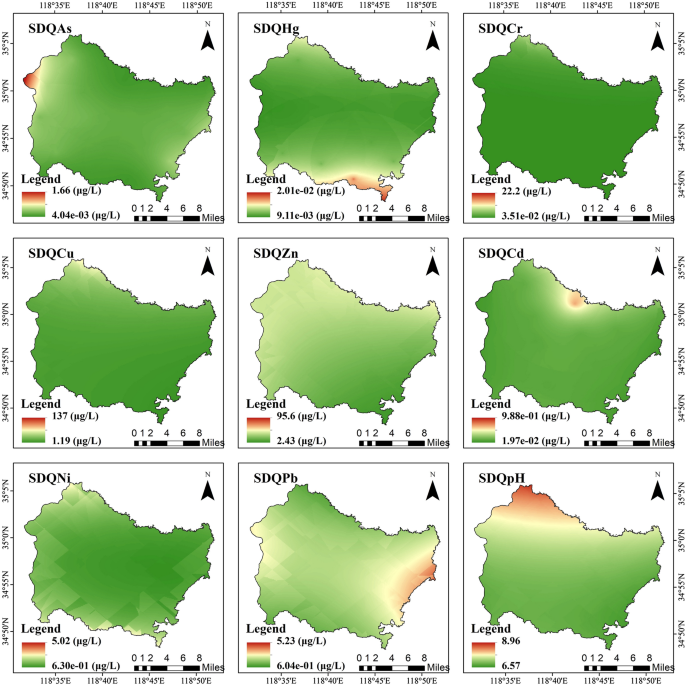
Atmospheric dry and wet deposition were collected from 15 samples in the study area. The dates were then interpolated using the Kriging interpolation method to determine the values of atmospheric dry and wet deposition at the 37 sampling points. Table 2 show the content characteristics of the atmospheric dry and wet deposition, respectively. The atmospheric dry deposition generally contained higher heavy metals levels than the wet deposition, with differences in their coefficient of variation, which might be attributed to the nature of the heavy metal elements and climatic factors33. The coefficient of variation of atmospheric dry deposition was 91.7%, while that of atmospheric the wet deposition was 249%. Overall, the coefficient of variation exceeded 30.0% for both dry and wet deposition, except for As and Hg in the dry deposition. This result suggests significant differences in the distribution of atmospheric dry and wet deposition in the region. Similarly, according to the distribution of atmospheric dry and wet deposition (Figs. 7 and 8), the same conclusion can also be drawn.
Distribution characteristics of heavy metals in atmospheric deposition
The distribution of heavy metals in atmospheric deposition is illustrated in Figs. 7 and 8. The concentration of As in atmospheric dry deposition exhibits a higher level in the southwest and a lower level in the northeast, primarily attributed to coal-fired dust emissions. On the other hand, the As in atmospheric wet deposition was higher on the east and west sides, lower in the middle, and peaked in the west. Regarding Cr concentration in atmospheric dry deposition, it is notably elevated in the northeast due to rock differentiation debris and weathering dust from rocks with high background values. However, no significant variation was observed for Cr concentration across the study area. The distribution of Cd content in atmospheric deposition exhibited consistency between dry and wet deposition, with higher concentrations observed in the northern regions. This was mainly due to industrial production activities such as smelting and calcination of non-ferrous metals, sintering of ores, and treatment of Cd-containing wastes. The geological lithology of the region is primarily monzonitic granitic gneiss, which may also be related to the high concentration of Cd. The distribution of Hg content in atmospheric deposition was consistent in dry and wet deposition, with higher values in the south and lower in the north, with a well-defined north–south boundary. The concentration of Hg in atmospheric deposition primarily stems from the extensive utilization of fossil fuels. Moreover, the elevated levels of Cu in atmospheric dry deposition are observed in both southeastern and northwestern regions, which coincide with proximity to major highways and primary sources of atmospheric deposition. The concentration of Cu in atmospheric wet deposition exhibited a higher level in the northern region, while other areas demonstrated a more uniform distribution pattern. In terms of atmospheric dry deposition, the concentration of Zn was found to be elevated in the southeast due to various anthropogenic activities such as roasting zinc sulfide ore, smelting and processing impurity metals containing Zn, steel production, waste incineration, rubber tire wear, and coal combustion. Notably, there were no significant variations observed in the distribution of Zn in atmospheric wet deposition. The concentration of Ni in atmospheric dry deposition was higher in the central-eastern region and lower in the surrounding areas, and there was no significant difference in the distribution of Ni in atmospheric wet deposition. The concentration of Pb was found to be higher in the central and southwestern regions, which can be attributed to industrial pollution and automobile exhaust resulting from the relatively developed industry and a high number of transport vehicles in these areas. Moreover, there was an elevated content of Pb observed in atmospheric wet deposition specifically in the eastern region.
Correlation of heavy metals in the soil, atmosphere, and grains
In order to investigate the relationship between soil, atmospheric deposition (DAD: dry atmospheric deposition of heavy metal content; WAD: wet atmospheric deposition of heavy metals), and heavy metal content in wheat grains, we initially constructed a box plot illustrating the levels of heavy metals in soil, atmospheric deposition, and wheat grains (Fig. 9). The overall trend reveals the common characteristics shared by all elements. The concentration of heavy metals in atmospheric wet deposition is relatively low, whereas the concentration of heavy metals in atmospheric dry deposition is comparatively high. With the exception of As, the concentrations of other elements in atmospheric drying are significantly higher than those found in soil. In terms of concentration alone, the migration of heavy metals through atmospheric deposition exhibits greater advantages compared to that observed in soil.
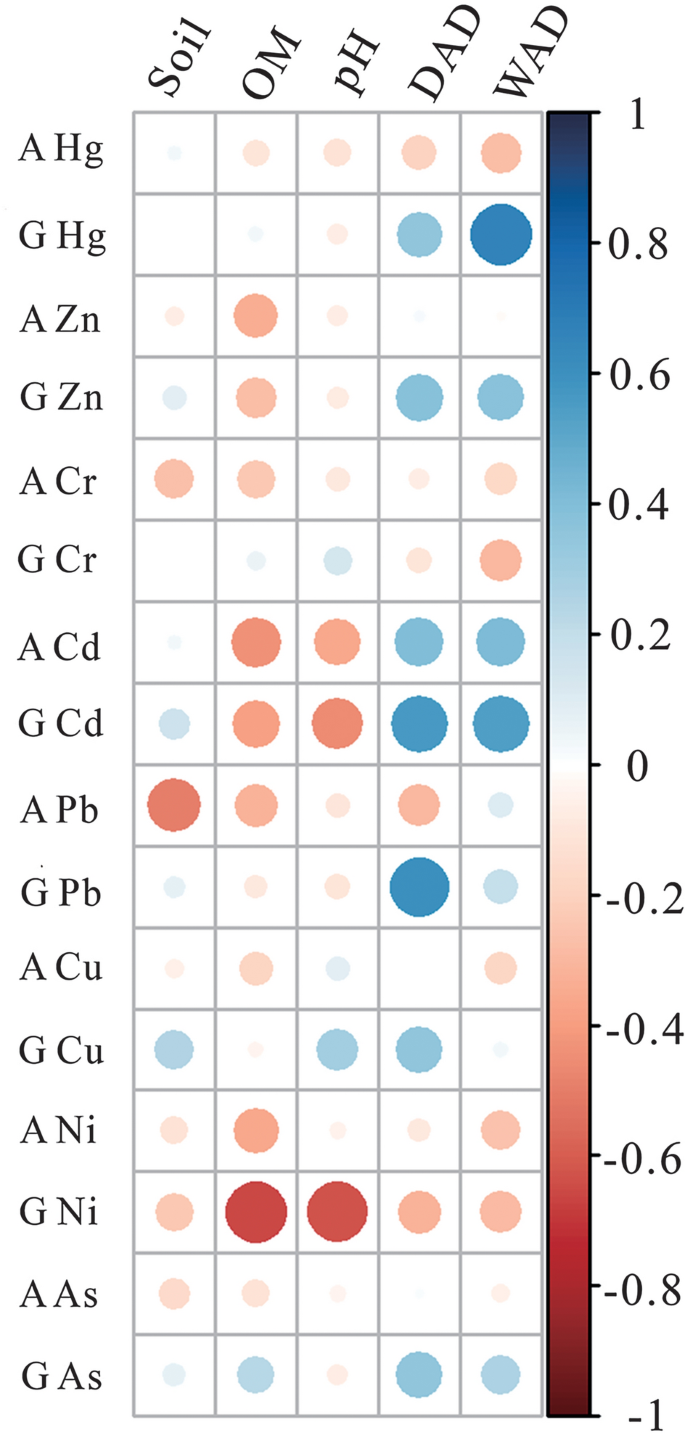
Pearson’s correlation analyses were conducted to investigate the associations between heavy metal concentrations in wheat rhizosphere soil, wheat roots, stems, and leaves, wheat grains; atmospheric dry and wet deposition; soil OM; and soil pH (Fig. 10).
We observed no significant correlation between the Hg concentration in wheat grains and the concentration of heavy metals in soil. However, a significant correlation was found between the Hg concentration in wheat grains and both dry deposition (R2 = 0.351, P < 0.05) and wet deposition (R2 = 0.667, P < 0.01) of atmospheric Hg. The Cd content in wheat grains showed a significant positive correlation with atmospheric dry deposition (R2 = 0.562, P < 0.01) and wet deposition of Cd (R2 = 0.549, P < 0.01). Similarly, the Cd content in roots, stems, and leaves exhibited a significant positive correlation with atmospheric dry deposition (R2 = 0.402, P < 0.05) and wet deposition of Cd (R2 = 0.414, P < 0.05). However, a significant negative correlation exists between the Cd content in wheat and the levels of OM and pH.
The Pb content in wheat grains showed a significant positive correlation with the atmospheric dry deposition of Pb (R2 = 0.605, P < 0.01), while the Pb content in roots, stems, and leaves exhibited a significant negative correlation with soil Pb (R2 = − 0.494, P < 0.01). The As content in wheat grains was significantly correlated with atmospheric dry deposition of As (R2 = 0.356, P < 0.05); however, the correlations with other plant parts were weak. The Zn content in wheat grains was significantly correlated with both atmospheric dry deposition of Zn (R2 = 0.387, P < 0.05) and atmospheric wet deposition of Zn (R2 = 0.370, P < 0.05), as well as with the content in roots, stems, and leaves (R2 = 0.583, P < 0.01). The Zn content in roots, stems, and leaves exhibited a significant negative correlation with OM (R2 = − 0.334, P < 0.05). Cu in wheat grains demonstrated a significant positive correlation with atmospheric dry deposition of Cu (R2 = 0.359, P < 0.05), as well as the content in roots, stems, and leaves (R2 = 0.583, P < 0.01). Furthermore, the Cu content in roots, stems, and leaves displayed a significant positive correlation with wheat grains (R2 = 0.422, P < 0.05).
The Ni content in wheat grains showed no significant correlation with atmospheric deposition of Ni, but exhibited significant correlations with OM (R2 = − 0.654, P < 0.01), pH (R2 = − 0.623, P < 0.01), and the content in roots, stems, and leaves (R2 = 0.319, P < 0.05). Additionally, the Ni content in roots, stems, and leaves was significantly correlated with OM (R2 = − 0.351, P < 0.05). Notably, no significant correlation was observed between the Cr content in grains.


