
XAU/USD Current price: $3,999.93
- Escalating Middle East tensions spurred demand for safety at the beginning of the week.
- The Federal Reserve will announce its decision on monetary policy this Wednesday.
- XAU/USD corrected near-term overbought conditions, additional slides with limited potential.
Spot Gold peaked at $3,452.41 at the weekly opening, retreating towards the current $3,400 price zone throughout the day. The bright metal benefited from weekend headlines spurring risk aversion amid an escalating conflict between Israel and Iran. Middle East tensions continue, but the mood somehow improved, weighing on the bright metal.
Meanwhile, United States (US) President Donald Trump discussed multiple subjects during his public appearance at the G7 meeting. On the one hand, he referred to a trade deal with Canada, stating that a deal with the neighbouring country is achievable within days or weeks. On the other, he announced Iranians want to talk about a de-escalation adding “ Iran is not winning this war. They should talk before it’s too late.” Finally, Trump claimed that throwing Russia out of the G7 group was a mistake and that he would not mind China joining the group.
At the same time, Iranian State Media reported that the country is preparing for the “largest and most intense missile attack in history on Israeli soil.”
His words helped the Greenback trim part of its early losses, although the US Dollar (USD) remains on the back foot across the board ahead of upcoming first-tier events. The country will publish May Retail Sales figures on Tuesday, while the Federal Reserve (Fed) will announce its decision on monetary policy on Wednesday. The Fed is widely anticipated to keep interest rates on hold amid uncertainty about the economic future.
XAU/USD short-term technical outlook
The daily chart for the XAU/USD pair shows it is battling to retain the $3,400 mark, yet also that the risk of a steeper decline is well limited. Technical indicators hold within positive levels, well above their midlines without clear directional strength. At the same time, the pair develops well above all its moving averages with a bullish 20 Simple Moving Average (SMA) providing dynamic support at around $3,339.15.
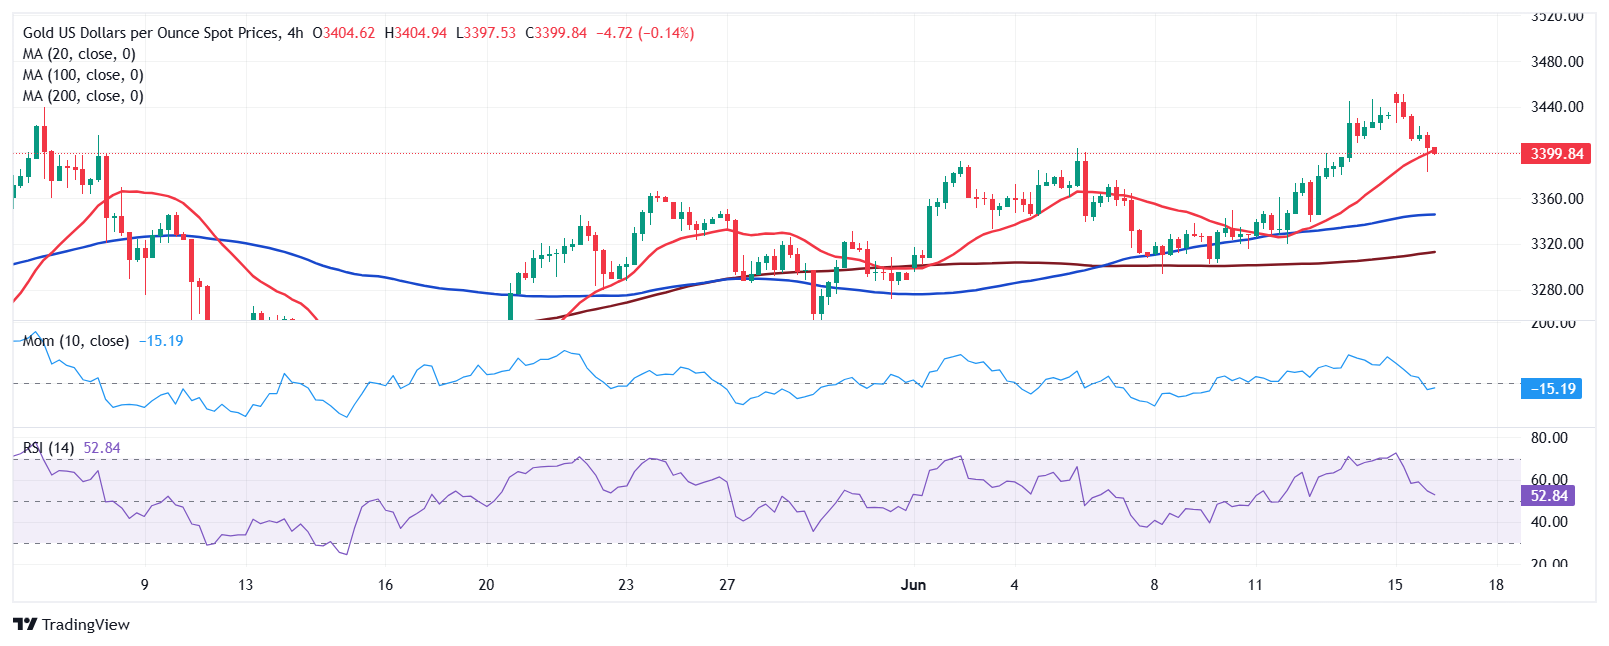
The near-term picture suggests the corrective slide could be completed. The XAU/USD pair is just above a bullish 20 SMA in the 4-hour chart, quickly recovering after briefly piercing it. At the same time, technical indicators corrected overbought conditions, but remain above their midlines. The Momentum indicator remains flat, while the Relative Strength Index (RSI) indicator heads south at around 53, not enough to confirm another leg south.
Support levels: 3,386.80 3,371.55 3,364.90
Resistance levels: 3,414.60 3,437.853,451.10