XAU/USD Current price: $3,297.13
- A better market mood put pressure on the bright metal on Tuesday.
- The United States will release the FOMC meeting Minutes on Wednesday.
- XAU/USD pressures a near-term key support area, could resume its advance.
Spot Gold fell on Tuesday, piercing the $3,300 level during European trading hours and remaining soft after Wall Street’s opening. Upbeat United States (US) data helped the Greenback.
The country reported that Durable Goods Orders declined by 6.3% following a 7.6% increase (revised from 9.2%) reported in March, yet slightly better than the market expectation for a decrease of 7.9%. Additionally, the Conference Board’s Consumer Confidence Index rose to 98.0 in May, following the 86.0 (revised from 85.7) posted in April. The Expectations Index, which measures short-term expectations for income, economic activity, and employment, gained 17.4 points to 72.8, although holding below the 80-point level that signals economic contraction.
Following a dive in pre-opening trading, US indexes are firmly up mid-American session, with the Dow Jones Industrial Average (DJIA) up over 600 points. The better mood can also be attributed to progress in trade talks. US President Trump announced negotiations with the EU will soon take place, expressing confidence in a fair deal coming up.
The focus shifts to the Federal Open Market Committee (FOMC) Minutes, to be out on Wednesday. The FOMC decided to keep the benchmark interest rate on hold when it met early in May, and the document is expected to shed some light on the decisions’ background, while it could also hint at future monetary policy decisions.
XAU/USD short-term technical outlook
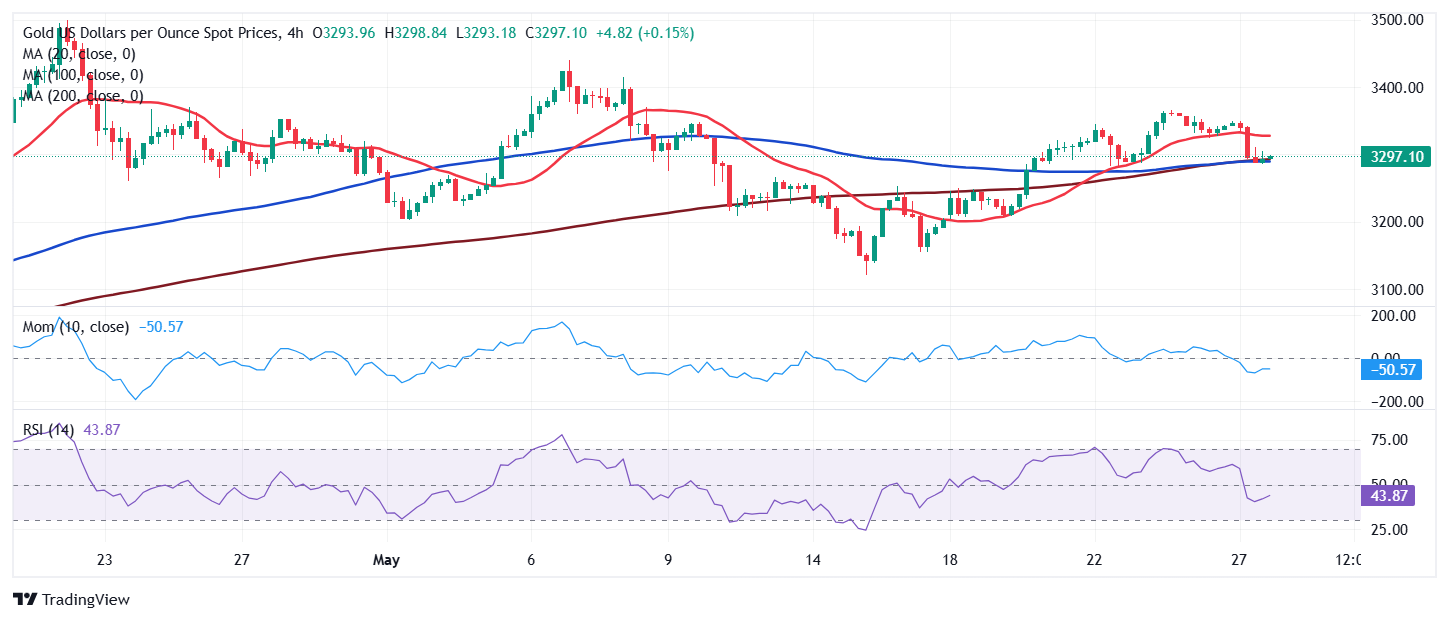
From a technical point of view, the daily chart for the XAU/USD pair shows it is pressuring a key dynamic support, which for now holds. A flat 20 Simple Moving Average (SMA) stands at around $3,288, while the pair bottomed for the day at $3,285.64. The same chart shows the 100 and 200 SMAs maintain their firmly bullish slopes far below the shorter one, limiting the longer-term bearish potential. The Momentum indicator crossed its midline into negative territory, but lost its downward strength, while the Relative Strength Index (RSI) indicator turned lower at around 52, reflecting the ongoing slide but falling short of anticipating another leg south.
The 4-hour chart shows XAU/USD fell below its 20 SMA, now providing dynamic resistance at around $3,326, while it bottomed around converging 100 and 200 SMAs. Finally, technical indicators offer neutral-to-bearish slopes within negative levels, skewing the risk towards the downside without confirming it. A recovery beyond the mentioned $3,320 area should see buyers taking back control of the bright metal.
Support levels: 3,285.20 3,272.40 3,258.10
Resistance levels: 3,326.00 3,335.90 3,349.65