Lowland Investment Company’s (LON:) unconstrained, multi-cap investment policy differentiates it from most peers in the AIC UK Equity Income sector, offering investors broad market exposure outside of the large, traditional ‘income stocks’.
While a re-rating of small- and mid-cap companies versus larger peers would be beneficial for LWI, it has nonetheless outperformed its broad market benchmark in each of the past two financial years. This has been driven primarily by stock selection and the positive impact of gearing in a rising market.
Meanwhile, on a trailing basis, the dividend yield is ahead of the broad market yield of c 4% and the company is returning capital through share buybacks.
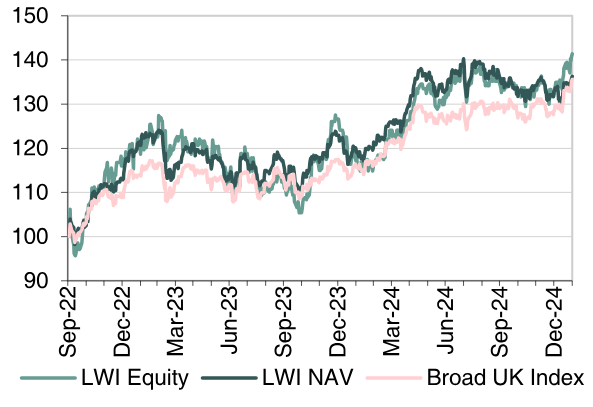
Performance Since the End of FY22
Source: LSEG Data & Analytics
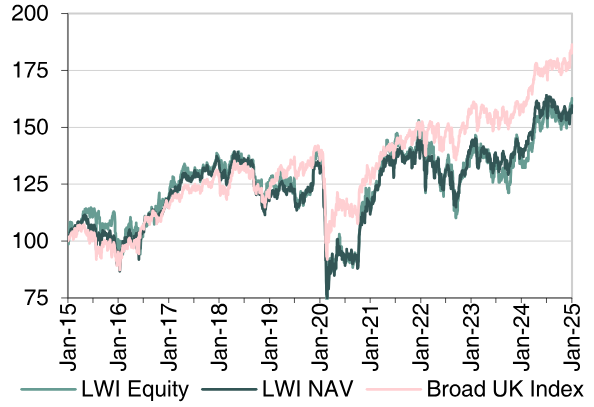
Performance Over 10 Years
Source: LSEG Data & Analytics
In its last two financial years (to September 2024), LWI delivered strong absolute NAV total returns, well ahead of its broad market benchmark, although much of this has been given back in FY25 to date.
The marked underperformance of domestically focused businesses, of which there is a strong small- and mid-cap (‘smaller’) company representation, since Brexit, still weighs on performance. With typically no more than 50% invested in the largest stocks versus a benchmark weight of more than 80%, the underperformance is now apparent in the 10-year data.
The recent outperformance was driven by stock selection, including among the large-cap holdings, and gearing (11% recently), one of the benefits of the investment trust structure.
The strong historical and relative valuation opportunity in smaller companies that the managers identify is yet to be widely recognised in the market. However, low valuations are being increasingly underpinned by takeover activity, including several LWI holdings.
The margin by which overseas-oriented, often defensive larger stocks have outperformed their smaller peers has certainly narrowed in the past two years, but a sustained shift in market leadership is yet to be confirmed.
Recent indications are that UK interest rates will be higher for longer, while expectations for UK growth are again being pared back. Neither is positive for domestic earning companies while overseas earners have a translation benefit from weaker sterling.
However, the managers believe that a tough economic outlook is more than priced into share prices and note that a recovery towards historical norms of profits and valuations would be a potent cocktail for returns. They argue that buying good stocks when they are on low valuations has historically enhanced long-term returns.
Meanwhile, investors in LWI benefit from an attractive yield, with a board that is determined to take measures to manage the discount to NAV.
An Alternative Approach to Income Growth
LWI seeks to provide investors with a higher than average return, with growth in both capital and income over the medium to long term by investing in a broad spread of predominantly UK companies.
The trust measures its performance against the broad UK market, although it invests across the whole range of market capitalisations, unconstrained by index weightings.
This flexible, multi-cap approach enables the trust to invest in companies that have greater growth potential, usually but not always small- and mid-cap, increasing the capital base of the portfolio and distributable income over time and thereby supporting the progressive dividend strategy. In this respect, LWI is clearly differentiated from the majority of peers in the AIC UK Equity Income sector, which typically have a greater focus on traditional ‘income’ areas of the market.
The trust was established in 1963 and is managed jointly by James Henderson (since 1990) and Laura Foll (since 2013) of Janus Henderson Investors (JHI). In turn, they are supported by the broader resources of the JHI equity team.
The managers consistently apply a patient, long-term, bottom-up investment strategy, with a strong valuation overlay. They seek companies that have an underlying strength that is yet to be realised by the market.
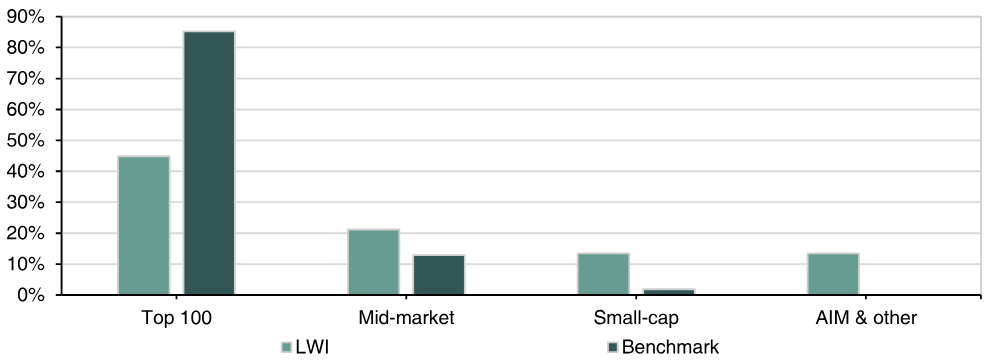
By market capitalisation, the trust’s portfolio is typically split between larger, medium and smaller companies in equal parts, intended to optimise the balance between immediate income and income growth over time. The weighting towards larger companies is rarely above 50% and at the end of September 2024 (end FY24) it was 45%.
Exhibit 1: LWI Portfolio by Market Cap Segment at End FY24
Source: LWI
Summary of the Investment Case
We recently published a note and webinar highlighting the significant attractions of the UK equity market. In this context, the key reasons to consider an investment in LWI at this time, explored in detail in this report, include:
- Sentiment towards UK equities is poor and although the market has been rising, the level of valuation remains low in historical and relative terms. For smaller companies this is even more so. The trailing P/E for the LWI portfolio is c 10x, substantially below the 10-year average of 13x, and below the broader UK market valuation of c 12x.
- While the valuation opportunity in SME companies has not yet been widely recognised in the market, low valuations are being increasingly underpinned by a high level of takeover activity, including several LWI holdings over the past year, such as DS Smith (LON:), Wincanton and Finsbury Food.
- Smaller companies are typically more exposed to the UK economy than larger companies and, with the economic outlook uncertain, it may be too early to anticipate a sustained turn in the relative fortunes of smaller equities. However, expectations for the UK economy are already low and the investment managers believe that in many cases a tough economic outlook is more than priced into valuations. Moreover, equities, including smaller companies, should not be seen as a proxy for the UK economy and the managers are targeting businesses that are well managed, with conservative balance sheets and often market-leading positions, as well as low valuations. These are in many cases the types of businesses on the receiving end of bids, at levels that are significantly ahead of market values but, disappointingly for the managers, below what they believe to be their fair value.
- LWI has a strong commitment to dividends and and the traing yield is 4.8%. The dividend has been maintained or increased each year since it was established in 1963, including through the pandemic. The last quarterly DPS increase (to 1.625p) was in respect of Q424, representing a 2.8% increase on the previous level.
Exhibit 2: Flexing Reserves to Deliver Progressive Dividends
Source: LWI data, Edison Investment Research
Performance Analysis
LWI benchmarks its performance against the broad UK equity market index, although its clearly expressed and consistently applied strategy means that its weightings, by market cap, stock and sector, are inevitably and structurally very different. Performance divergence from the benchmark is to be expected over shorter periods, but the extent and duration of smaller company underperformance since the post-pandemic peak in 2021, particularly for AIM-listed stocks, is notable and is now reflected in the trust’s 10-year performance data.
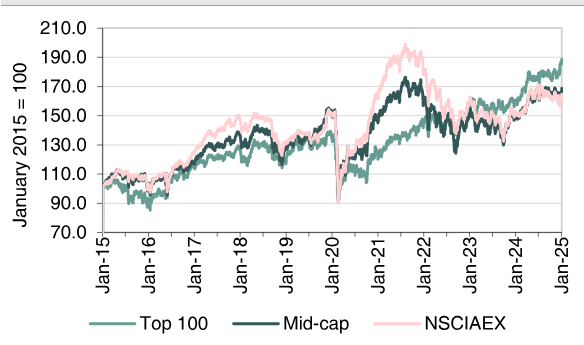
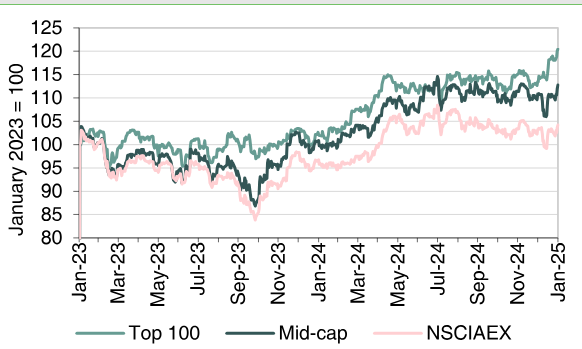
The charts below compare the total return performance of the largest 100 stocks in the UK with the mid-cap stocks and the Numis Smaller Companies Index, including AIM, but excluding investment trusts (NSCIAEX). In the three years to 31 December 2024, the mid-caps have trailed the top 100 stocks by almost 30pp and the NSCIAEX by almost 40pp.
Exhibit 3: Market Performance by Market Cap Segments (Long-Term)
Source: LSEG Data & Analytics
Exhibit 4: Market Performance by Market Cap Segment (Two Years)
Source: LSEG Data & Analytics
In part because successful smaller companies have a tendency to outperform over time, and in spite of the recent challenges, LWI has a strong track record of long-term performance and outperformance of its benchmark.
Over 25 years, its NAV total return is 614% compared with the broad equity market index return of 243%. However, taking the data to end January 2025, LWI’s NAV total return is behind the benchmark over one, three, five and 10 years.
Exhibit 5: Performance Data
Source: LWI
Breaking the performance down into discrete years provides an insight into returns, in different market conditions, over the past 10 years. We note the tendency for LWI to outperform the benchmark when investor sentiment is positive and the broad market is rising strongly.
Exhibit 6: Performance Data on a Financial Year Basis
Source: LWI. Note: Year-end 30 September.
Putting aside the pandemic volatility, the trend change in the fortunes of smaller companies coincides with that of the Brexit vote. A key factor in this is likely to be a widely held, more pessimistic view of the UK economic growth outlook adopted at that time and confirmed by subsequent performance. Smaller companies are on average more exposed to the UK economy than larger, often more international, companies. In the five years ending FY15, in the run up to the Brexit vote in 2016, LWI delivered an NAV total return of c 101%, c 63% ahead of its broad market benchmark. However, in the period since, and up to end FY24, LWI’s NAV total return of c 61% was c 26% behind the broad market.
LWI’s outperformance in FY23 (3.3pp versus the benchmark) was despite the largest companies, on average, seeing stronger share price rises than smaller companies. Market leadership switched around in FY24, with smaller companies delivering the strongest gains, supporting continued outperformance (2.9pp) from LWI. In both years, outperformance was driven by stock selection, including a positive impact from takeover activity, as well as the benefits of gearing in a rising market, more than offsetting the drag from market cap allocation. In FY24, top 100 stocks like Rolls-Royce (LON:) and Marks & Spencer, as well as banks NatWest (LON:) and Barclays (LON:) were strong performers, more than making up for the relative underweighting of the portfolio to this market segment. Stock selection in AIM-listed stocks was also strong, but was more than offset by the weighting to this market segment.
Exhibit 7: Attribution Analysis, Based On Debt At Par Value And Gross Of Management Fees (Differs Slightly From The NAV Performance Data Used Elsewhere In This Report)
Source: LWI
In the most recent four months, to end January 2025, smaller companies have not followed the gains in larger companies and have shown some modest weakness. During this period, expectations for UK growth have been pared back, while many larger companies will have benefited, in translation at least, from the decline in sterling. A sustained revival in the relative performance of smaller companies is yet to be confirmed. During this same period, we estimate that LWI NAV’s total return is flat, trailing the benchmark return of c 5%.
Exhibit 8: Mid-Cap Companies vs. Top 100, Monthly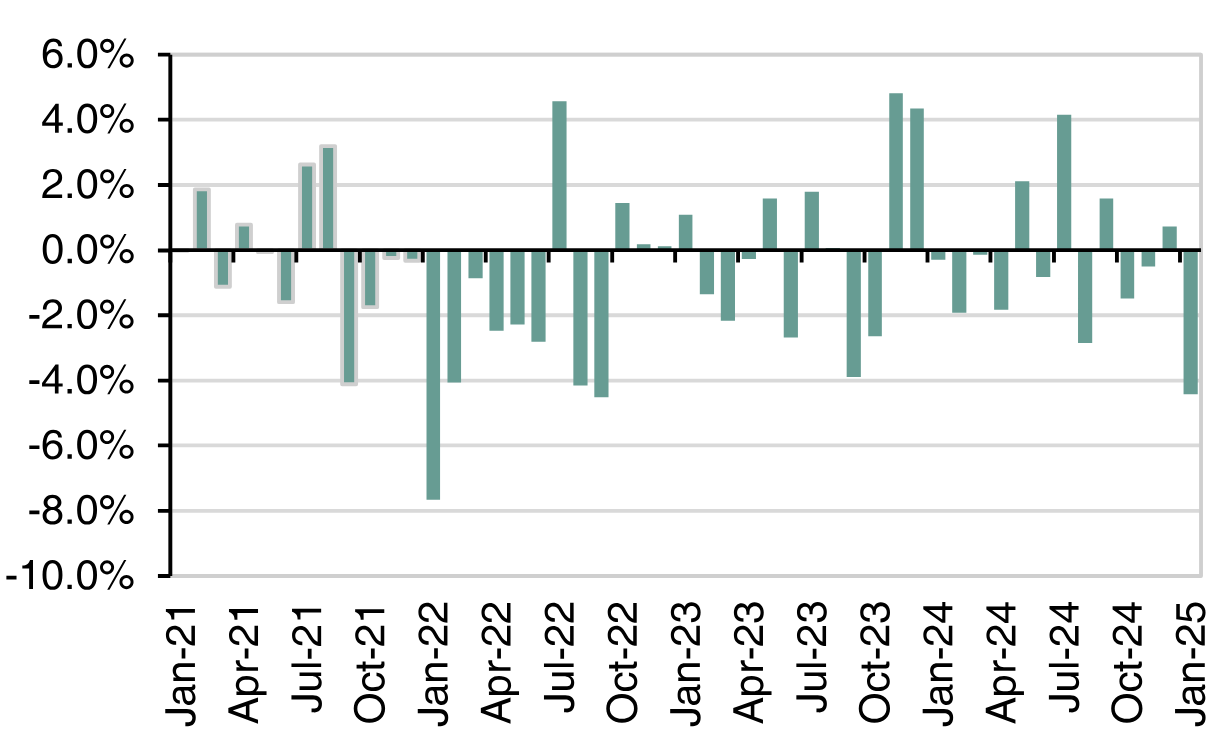
Source: LSEG Data & Analytics, Edison Investment Research
Exhibit 9: Small-Cap Companies vs. Top 100, Monthly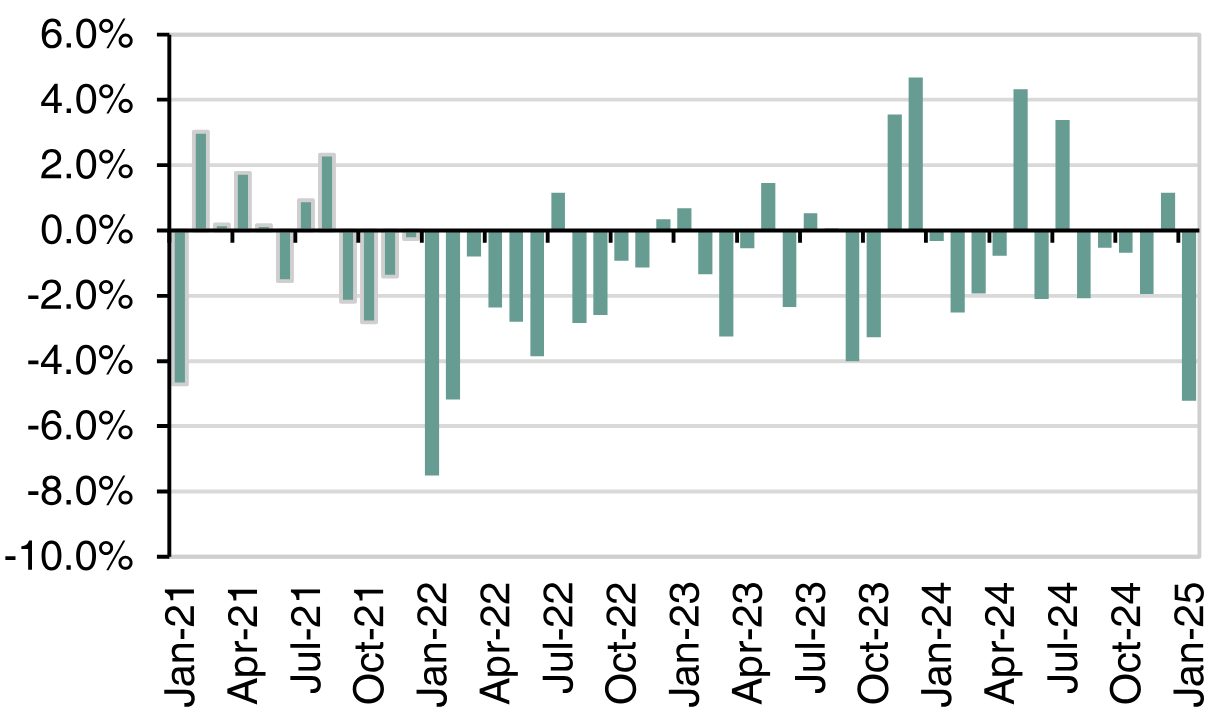
Source: LSEG Data & Analytics, Edison Investment Research
Discount and Discount Management
Based on NAV at fair value including income, LWI is trading at a discount of 7.5%, not materially different from that of its peers. Over the past year, the discount has averaged 11%, with a low of 5% and a high of 15%. Over three years, the average discount has been 7%, within a range of 1–15%. With smaller companies significantly out of favour, the discount had been widening. The recent narrowing coincides with strong gains in the UK market, an improvement in the relative performance of smaller companies, an improvement in the trust’s performance and the commencement of share buybacks. The board has taken a cautious approach to share buybacks, even as the discount widened, conscious that a permanent capital base is one of the key benefits provided by a closed-end fund structure. This is particularly relevant for smaller company investments where liquidity can become thin and where a patient, long-term approach may be warranted. By reducing the size of the trust, share buybacks may increase the ongoing charge ratio and reduce trading liquidity in the trust’s shares. Quite reasonably, with the trust delivering strong absolute and relative performance over the past two years (and over the long term), the board had expected the discount to close. However, it has remained flexible and, adapting to prevailing market and sector conditions, has recently commenced share repurchases. Using its authority to repurchase up to 15% of the share capital, the company has bought back 18.0m shares (6.7% of the total).
At the current level of discount, repurchases will have a modest accretive effect on NAV per share. More significant is their positive impact on the demand-supply balance for the shares and the clear message that it sends about the board’s intention to maximise shareholder returns.
Exhibit 10: Long-Term P/NAV (Cum Income at Fair Value)
Source: LSEG Data & Analytics
Portfolio Positioning
Portfolio diversification is a key element of risk management, primarily within the smaller company portion of the portfolio. At 31 January 2025, there were 120 holdings, at the top of the trust’s expected 100–120 range. Nine of the top 10 holdings were top 100 companies, with a focus on higher-yielding financials and oil and gas producers. Also, within the top 10 holdings was the non-life insurer FBD. In aggregate, the top 10 represented 24% of the portfolio, with the other c 110 holdings representing 77%.
Exhibit 11: Top 10 Portfolio Holdings at 31 January 2025
Source: LWI
With stock selection being bottom-up, sector weightings are substantially an output rather than a deliberate target. However, sector trading conditions and valuations will nonetheless have an impact on where the managers identify the best opportunities. and industrials account for c 66% of the portfolio, around 18pp above the benchmark. The financials holdings are skewed towards large-cap banks and insurers, with the exception of FBD, whereas the industrials holdings have a larger exposure to a broad range of mid-and small-cap companies. The reduction in the industrial weighting since March 2024 primarily reflects the sale of LWI’s highly successful investment in Rolls-Royce.
Exhibit 12: Sector Positioning at 31 January 2025
Source: LWI
Recent Activity and Current Opportunities
Position movements within the trust, both up and down, are typically undertaken in a gradualist way, with the managers adding to favoured positions on weakness and trimming outperfomers where valuation has begun to look stretched. Since end FY24, no significant position movements have been disclosed. Taking a longer perspective, the key sales were of the successful turnaround investments in Rolls-Royce and Marks & Spencer. Along with the proceeds from the takeovers of DS Smith, Wincanton and Finsbury Food, significant new investments were made in Beazley (LON:), Scottish & Newcastle, Shaftesbury, Workspace (LON:) and Dunelm (LON:).
We do not expect any radical changes to the portfolio in order to fund share repurchases, with incremental sales more likely. This will include the holding in Dowlais (0.7% of the portfolio at end December), which has since agreed a cash takeover at a 25% premium to the pre-bid price (a 45% premium to the average price over the previous three months).
Given the investment managers’ positive expectations for the market, an increase in gearing from the 11.0% reported at end FY24 also seems quite possible. This was the lowest end-year level of gearing in the past five years.
The average has been c 13% with a high of 15% in FY20. The trust’s borrowings are a mix of long-term, fixed-rate notes and floating-rate, medium-term bank facilities. The £30m loan notes do not mature until 2037 and the 3.15% pa cost is highly attractive in current market conditions.
The bank facilities, with BNP, allow LWI to draw up to £40m, priced at a lending margin of 0.9% plus the SONIA base lending rate. Around half of this (c £20m) had been drawn at end FY24 and the company also has an option (conditional on lender approval) to increase the facility by £20m.


