USD: Jun ’25 is Down at 100.050.
Energies: Jun ’25 Crude is Down at 61.20.
Financials: The Jun ’25 30 Year T-Bond is Lower by 52 ticks and trading at 111.24.
Indices: The Jun ’25 S&P 500 emini ES contract is 262 ticks Lower and trading at 5910.50.
Gold: The Jun’25 Gold contract is trading Up at 3243.90.
Initial conclusion
This is not a correlated market. The USD is Down and Crude is Down which is not normal, and the 30 Year T-Bond is trading Lower. The Financials should always correlate with the US dollar such that if the dollar is Higher, then the bonds should follow and vice-versa. The S&P is Lower and Crude is trading Lower which is not correlated. Gold is trading Higher which is correlated with the US dollar trading Down. I tend to believe that Gold has an inverse relationship with the US Dollar as when the US Dollar is down, Gold tends to rise in value and vice-versa. Think of it as a seesaw, when one is up the other should be down. I point this out to you to make you aware that when we don’t have a correlated market, it means something is wrong. As traders you need to be aware of this and proceed with your eyes wide open. All of Asia traded Lower with the exception of the Singapore exchange which is Higher. All of Europe is trading Lower.
Possible challenges to traders
- FOMC Member Bostic Speaks at 8:30 AM EST. This is Major.
- FOMC Member Williams Speaks at 8:30 AM EST. This is Major.
- FOMC Member Jefferson Speaks at 9:45 AM EST. This is Major.
- CB Leading Index m/m is out at 10 AM EST. This is Major.
- FOMC Member Logan Speaks at 1:15 PM EST. This is Major.
Traders, please note that we’ve changed the Bond instrument from the 10 Year (ZN) to the 2 Year (ZT). They work exactly the same.
We’ve elected to switch gears a bit and show correlation between the 2-year Treasury notes (ZT) and the S&P futures contract. The YM contract is the Dow Jones Industrial Average, and the purpose is to show reverse correlation between the two instruments. Remember it’s likened to a seesaw, when up goes up the other should go down and vice versa.
Yesterday the ZT dived Lower at around 7:30 AM EST with an avalanche of news pending. The Dow dived Lower at the same time. Look at the charts below and you’ll see a pattern for both assets. The Dow moved Higher at 7:30 AM EST and the ZT moved Lower at around the same time. These charts represent the newest version of Bar Charts, and I’ve changed the timeframe to a 15-minute chart to display better. This represented a short opportunity on the 2-year note, as a trader you could have netted a dozen ticks per contract on this trade. Each tick is worth $6.25. Please note: the front month for ZT is now Jun ’25 and the Dow is Jun ’25 as well. I’ve changed the format to filled Candlesticks (not hollow) such that it may be more apparent and visible.
Charts courtesy of barcharts
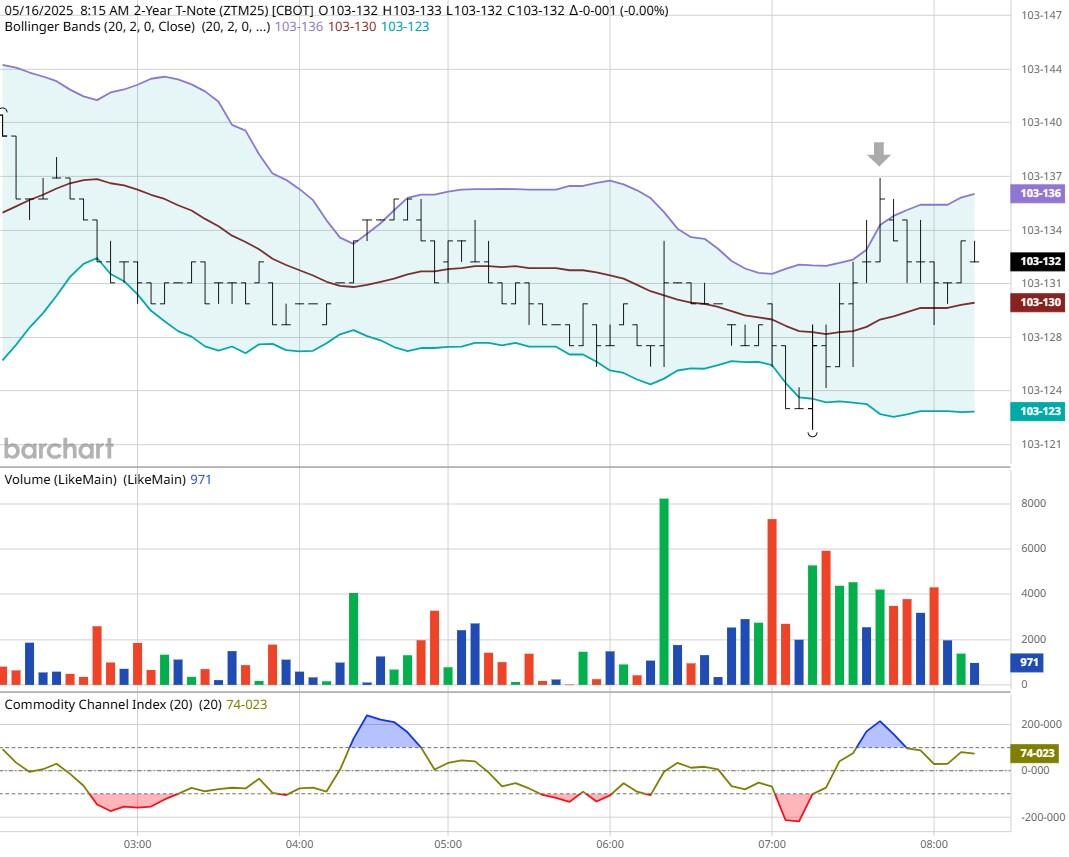
ZT -Jun 2025 – 5/16/25
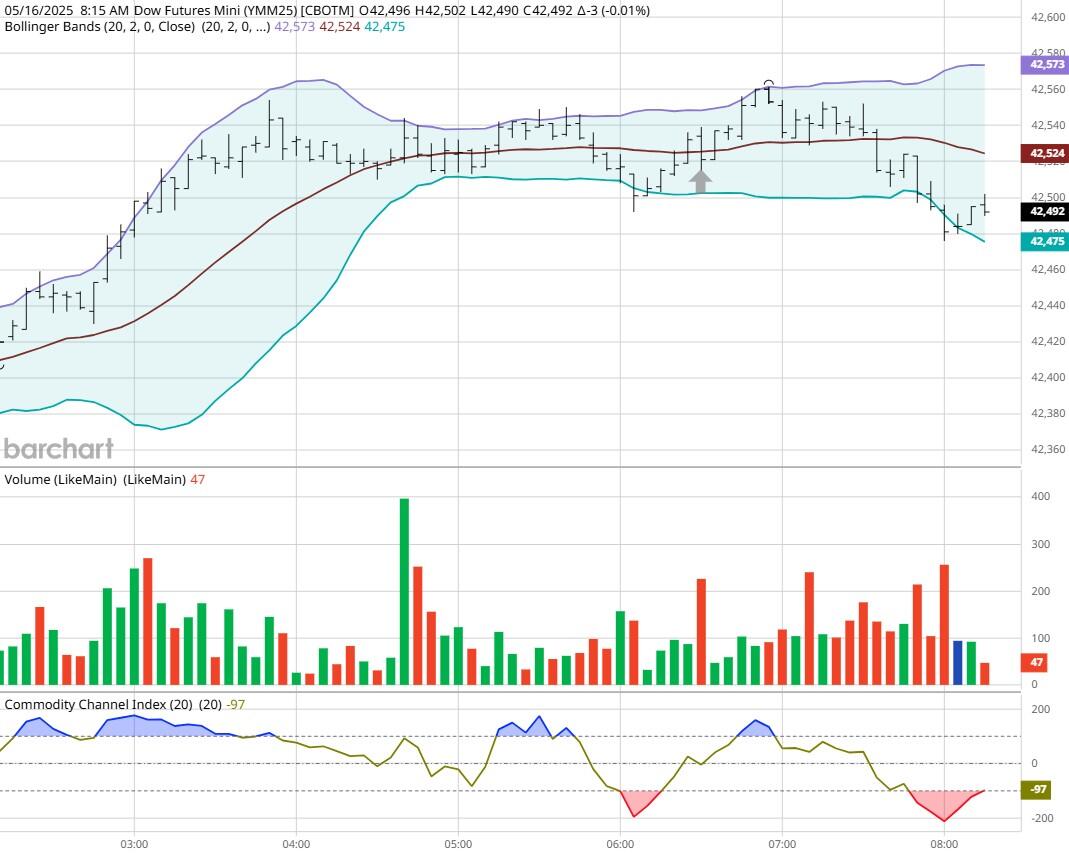
Dow – Jun 2025- 5/16/25
Bias
On Friday we gave the markets an Upside bias. The indices didn’t disappoint as the Dow closed Higher by 332 points and the other indices closed Higher as well. Today we aren’t dealing with a correlated market, and our bias is to the Downside.
Could this change? Of Course. Remember anything can happen in a volatile market.
Commentary
On Friday we simply followed our rules on Market Correlation and suggested an Upside Day and the markets didn’t disappoint.