

S&P 500 refused to keep the advance of course, and then the BoJ tiny hike – will it though be able to save stock market bulls when MSTR wildly swings to $1,500 and Bitcoin is now only $62,500? These metrics of risk taking as much as poor sectoral breadth (XLE is your refuge on the long side – don‘t be fooled by XLC putting in a great day yesterday (communications are to give up quite some of those gains fast) – tech performance was really weak, and will continue being so, with NVDA among the last to fall (first $880 then $860 with a pit stop at $870).
Bottom line, Friday‘s opex weakness was overcome Monday, but I don‘t give the coming days odds of returning price action above 5,225. This is how I summed up the BoJ implications in our channel earlier today – and it‘s the overall complacency of „this could have been worse“, that‘s most dangerous on the tail side of things, i.e. S&P 500 dropping by say one or two dozens of points very fast.
Way more details as usual in the chart section, Telegram and Twitter – just to remind you of Sunday‘s extensive analysis – appreciate the dollar coiling up as a sign of growing danger for risk taking as EURUSD continuing decline highlights.
(…) If in doubt, consider the barely there USD upswing Friday – good daily consolidation but once again 103.50 strong resistance called months earlier as a trouble maker not permitting the index getting far away from, looms – maybe 104 with backing and filling before slowing economy comes more into spotlight, ushering in implicit bets on Fed support of the economy to make a difference before Nov. Before that, higher for longer will reenter popular vocabulary some more.
BoJ is also set to start policy normalization in Apr as I called it to mid winter, and USD performance reflects stark deficit spending outside of a recession. It‘s though rather the more accommodative ECB mindful of eurozone economies flirting with recession, and yet EURUSD is still higher than where it was mid Feb – thanks to still easy global liquidity that would keep a lid on dollar appreciation.
No outhawking the Fed, and indeed there is room for a hawkish, not dovish surprise on Wednesday – fear not though more rate hikes, the disappointment would come on the rate cuts uncertainty front.
The S&P 500 correction barely started and has longer to run.
Let‘s move right into the charts – today‘s full scale article contains 3 of them, featuring S&P 500, precious metals and oil.
Tired of seeing those red boxes instead of way more valuable information? Try the premium services based on what and how you trade.
Gold, Silver and Miners
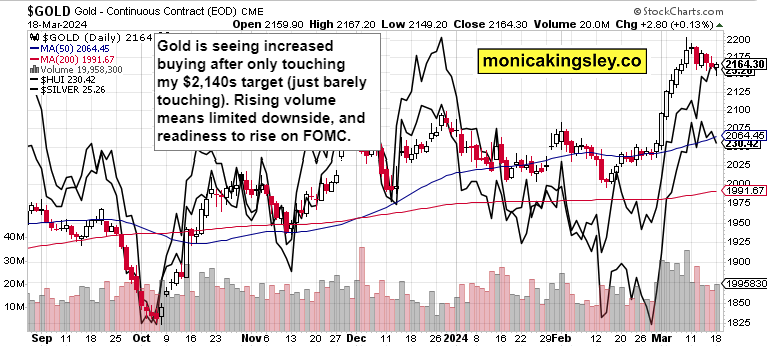
While gold is best insulated against the budding bearish move, it‘ll recover earliest from the risk-off turn. A more solid move into $2,140s is possible, but that‘s as far as a reasonable consolidation (purely technical and not confirmed by intermarket odds in my view) target is – I‘m not in favor of any 38.2% Fibonacci targets of $2,115 roughly, and instead expect recovery after FOMC.
Crude Oil
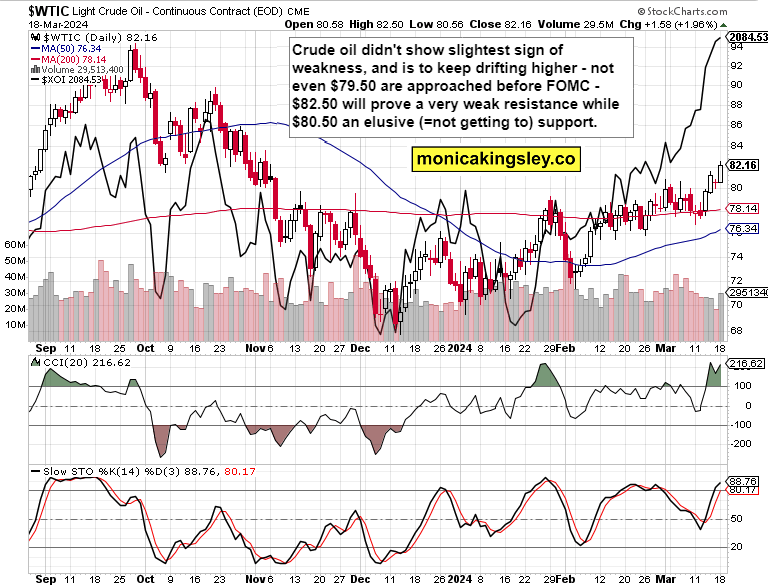
Oil didn‘t and isn‘t to offer many dips – the path of least resistance is higher, and XLE with oil names the refuge of those who have to pick something to remain long in the stock market.


