I like what I am seeing of late in the precious metals space.
Gold has broken out to new highs… and now silver is beginning to show strength.
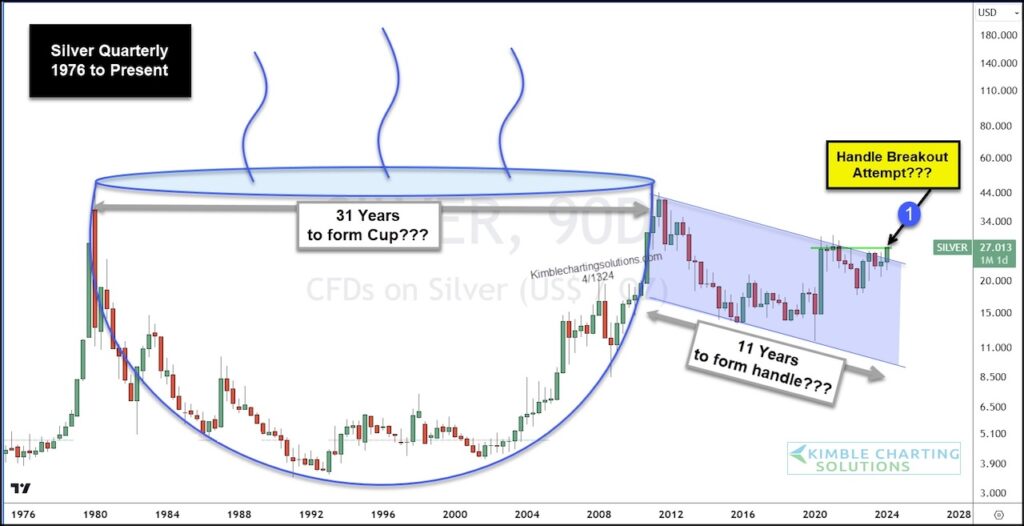
Today we take a look at a long-term “quarterly” chart of Silver, as it seems that something BIG might be brewing.
As you can see, Silver took 31 years to form a very large “cup” pattern, and the last 11 years forming what appears to be a “handle”. If so, this would be a massively bullish “cup with handle” price pattern.
Zooming in, we can see that Silver is attempting a “handle” breakout at (1). If this is successful, it would be very bullish and likely propel Silver to the top of the cup with handle formation near $40. Above that level and Silver is off to the races. Stay tuned!
Silver Futures Long-Term “quarterly” Chart
Note that KimbleCharting is offering a 2 week Free trial to See It Market readers. Just send me an email to services@kimblechartingsolutions.com for details to get set up.
Twitter: @KimbleCharting
The author may have a position in mentioned securities. Any opinions expressed herein are solely those of the author, and do not in any way represent the views or opinions of any other person or entity.