Gold Key Points
- The outcome of the Paris peace talks between Israel and Gaza could impact safe haven demand for gold.
- Top-tier inflation reports from Australia, the US, Germany, and the Eurozone will also exert an impact on gold.
- Gold is carrying short-term bullish momentum into the coming week, with potential for a move up toward the 2024 highs in the $2060 area.
Gold Weekly Forecast – Key Themes
Gold serves many purposes, from acting as a collectible to a currency to a safe haven asset to a (long-term) inflation hedge. In the coming week, the latter two use cases will be in focus.
Last week, gold caught an apparent safe haven bid midday Friday, driving the yellow metal to a 3-week high (see technical analysis below), though its not clear what specifically drove the move. As of writing, potential peace talks between Israel and Gaza are scheduled to take place in Paris, and perhaps traders seem some risk that those fall apart, extending the war.
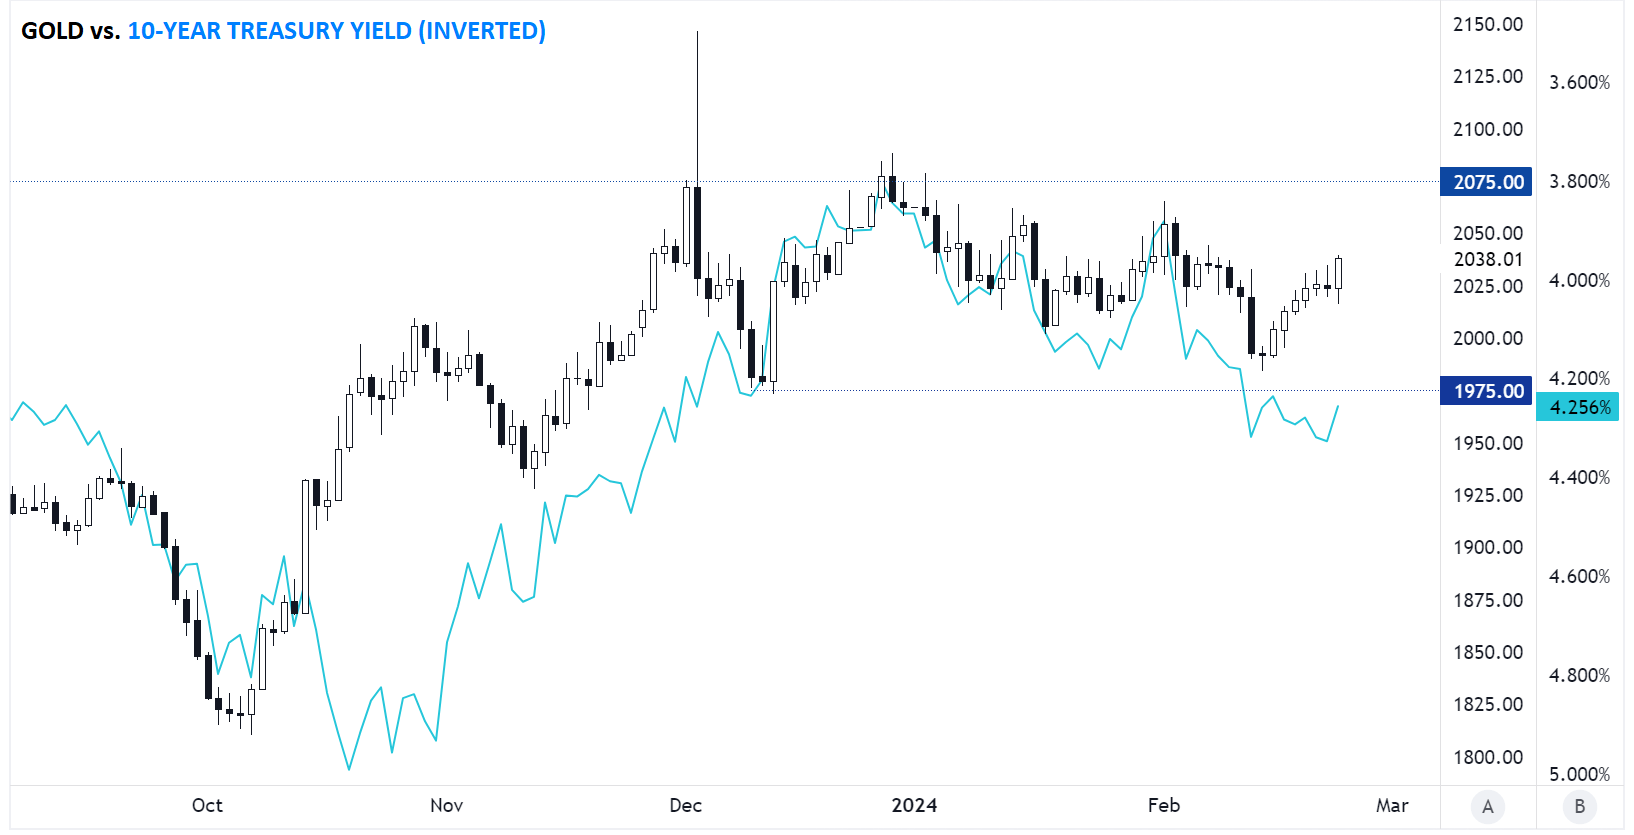
One way to see the gold’s safe haven demand is to look at its correlation with other safe havens like US Treasury bonds. As the chart below shows, gold’s price action remains closely correlated with the moves in bond yields (note the inverted axis, so gold prices are technically inversely correlated with bond yields):

Source: TradingView, StoneX
Accordingly, continued weakness in yields (strength in bond prices / blue line rising) in the coming week could support continued gains in the yellow metal.
The other key aspect of gold to watch will be its “inflation hedge” credentials. The economic calendar next week brings key inflation reports from Australia (CPI on Wednesday), Germany (CPI on Thursday), the US (Core PCE on Thursday), and the Eurozone as a whole (Flash CPI on Friday). The data we have thus far suggests that inflation reaccelerated somewhat in January, and if we see confirmation of that theory in the economic data over the coming week, gold could catch a bid (though that could also be partially ameliorated by an uptick in bond yields on expectations of fewer central bank rate cuts).
Between simmering geopolitical conflicts and a full slate of top-tier inflation reports, this could be a big week for gold traders.
Gold Technical Analysis – XAU/USD Daily Chart

Source: TradingView, StoneX
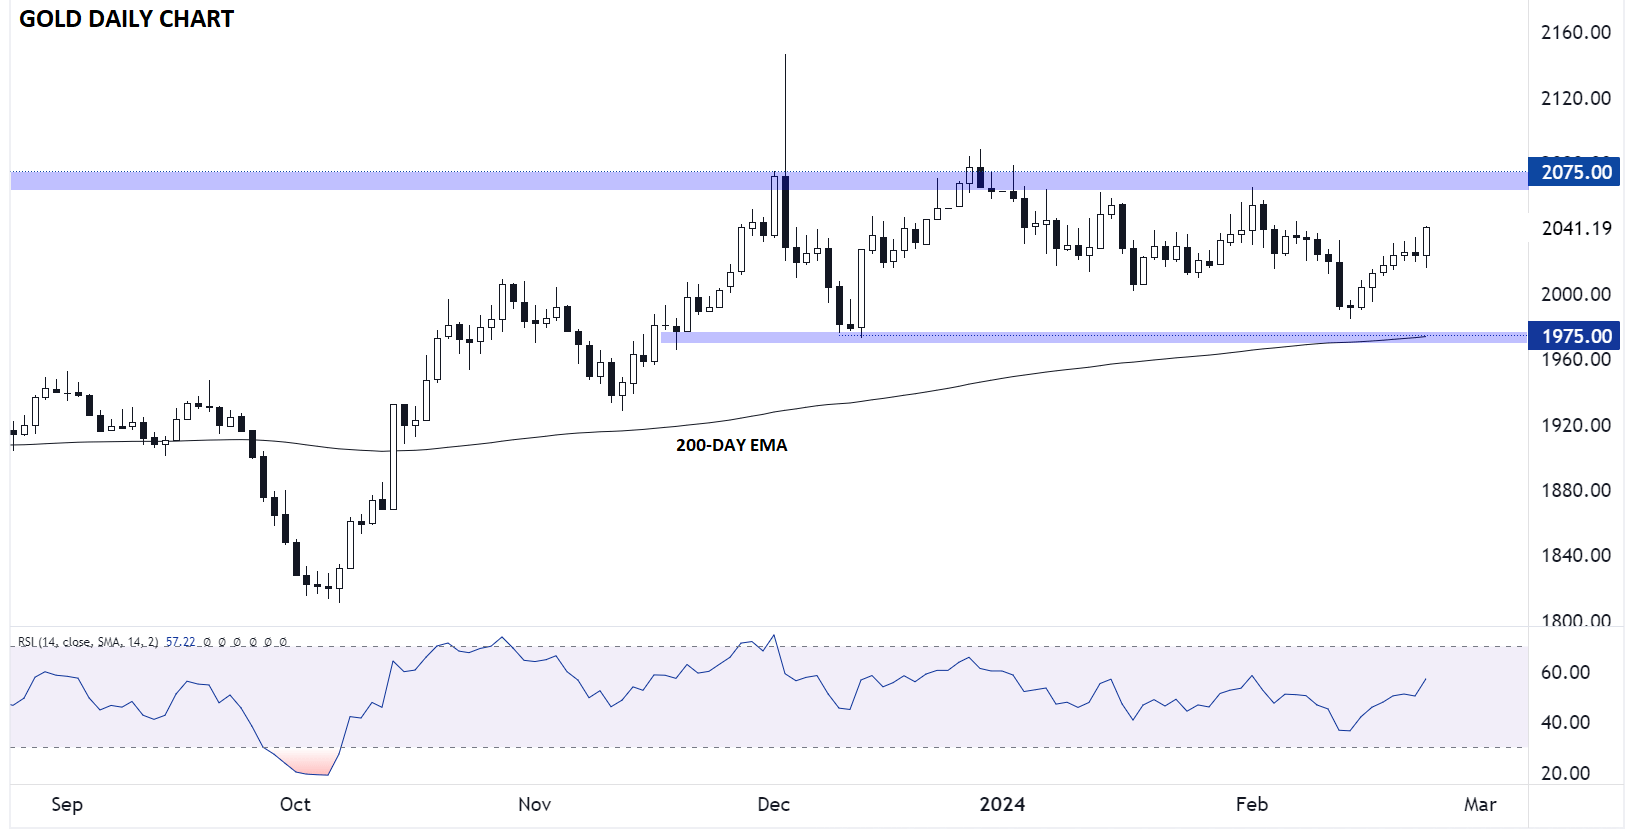
Looking at the daily chart of gold, the precious metal is seeing its biggest one-day rally in more than a month as of writing on Friday afternoon. From a technical perspective, gold still remains roughly in the middle of its 3-month range between $1975 and $2075. Despite rallying six of the last seven days, the 14-day RSI is still near neutral territory, so readers may want to carry over a bullish bias into this week.
If the bullish momentum continues from here, gold could rally toward the year-to-date highs in the $2060 area or even the record high in the $2075 zone, depending on geopolitical developments and economic data. Meanwhile, a bearish reversal this week could target the psychologically significant $2K level again.
— Written by Matt Weller, Global Head of Research
Follow Matt on Twitter: @MWellerFX


