

1. Market Situation: Not a bubble, but no longer a stage for mindless long positions
In May 2026, the U.S. Nasdaq Composite Index is trading near historical highs, while the S&P 500 and Nasdaq 100 continuously set new records. AI themes continue to dominate the market narrative, with sharp structural rallies occurring in the so-called “AI peripheral supply chain” sectors such as chips, optical modules, storage, and semiconductor equipment. Market sentiment is high, with the “bubble theory” and “golden age theory” coexisting as investors oscillate between greed and fear.
Against this backdrop, an investment strategy worth serious discussion is: actively reducing positions in some of the most extreme trending stocks while reallocating a portion of the gains to application-layer software stocks that suffered panic selling over the past six months. To be clear, this is not a bearish take on the long-term AI narrative, but rather a tactical rebalancing based on the risk-reward ratio. In other words, this is a “gear shift” rather than an “engine stall.”
Selling precisely at the peak is neither realistic nor necessary. The peak of market sentiment can only be identified in hindsight; any attempt at precise market timing is essentially a bet against market liquidity. What should truly trigger a decision to trim positions is when the risk-reward ratio has substantially collapsed —when the marginal satisfaction brought by a further 30% rise in a stock is significantly lower than the marginal pain brought by a 30% drawdown, the risk-reward ratio has deteriorated.
From the fundamental principles of investment, any sharp rally in an asset or sector is the result of both “fundamental drivers” and “sentiment drivers” firing together. Fundamentals might continue to improve for the next one or two quarters, but sentiment has its own inherent cyclicality—and sentiment reversals never provide advance notice. This article will analyze four trigger points overlooked by the mainstream market and propose a specific framework for response.
2. Concentration of Gains Surpasses the Dotcom Peak—But the Structural Nature is Completely Different
To understand the current market position, one must first look at key data from BTIG and Bloomberg. The firm tracked the average performance of the top 10 gainers in the Nasdaq 100 during three extreme historical periods: the top 10 gainers in 1999 rose an average of 559%; from March 1999 to March 2000, the 12-month peak of the Dotcom bubble, they rose an average of 622%; while over the past 12 months, the average gain of the top 10 has reached 784%—26% higher than at the peak of the Dotcom bubble .
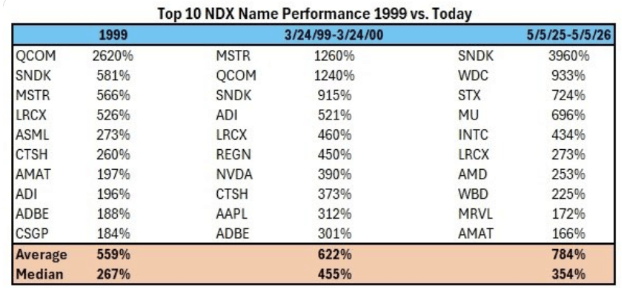
Source: BTIG, Bloomberg
Looking at this figure alone, the first reaction of a rational investor would be “bubble.” However, a subsequent structural breakdown reveals a key fact overlooked by the market: the current list of top 10 gainers does not consist of recognized AI leaders like Nvidia, Microsoft, or Alphabet, but rather SanDisk (+3,960%), Western Digital (+933%), Seagate (+724%), Micron (+696%), Intel (+434%), Lam Research (+273%), AMD, Marvell, and Applied Materials —stocks in storage, CPUs, and semiconductor equipment. In other words, the most parabolic gains in the market over the past year have not been in core AI assets, but in the “AI peripheral supply chain”—assets benefiting from the dual logic of an “industry cycle reversal” and an “AI concept premium.”
This observation leads to two extremely important judgments: First, the current valuations of true core AI assets are not as outrageous as the market’s intuition suggests. Compared to Cisco in 1999, which had a P/E ratio exceeding 200x at the peak of the Dotcom bubble—meaning it would take 200 years to recoup the investment based on its earnings at the time—Nvidia today, while widely considered “expensive,” has a TTM P/E ratio of approximately 42-45x; if calculated using consensus forward earnings estimates, the forward P/E is only 24-26x (Source: FinanceCharts, GuruFocus, Stock Analysis, May 2026). Nvidia’s valuation is high, but it is not expensive “purely based on storytelling”—its quarterly net profit already exceeds the combined earnings of the top 10 companies in the tech sector at the peak of the 2000 bubble.
Second, the true high-risk area is not in AI leaders, but in cyclical stocks elevated to sanctity by narratives like “unlimited capital expenditure” and “ever-accelerating AI demand.” This is precisely the direction warranting caution in this cycle—one should be wary not of the “future of AI,” but of the “shadow of AI.”
From fundamental data, the earnings support for core AI assets is not a castle in the air. As of the first quarter of 2026, OpenAI’s annualized recurring revenue (ARR) has surpassed $25 billion; Anthropic’s growth is even more startling—its annualized revenue has surged from approximately $9 billion at the end of 2025 to over $44 billion as of May 2026 (Source: Reuters, Financial Times, TradingKey), with market analysts expecting its ARR to potentially reach the $80 billion to $100 billion range by the end of 2026. The “AI donor” camp, including Microsoft, Google, Meta, and Amazon, has maintained double-digit earnings growth over the past four quarters, with free cash flow repeatedly hitting record highs. These are backed by tangible enterprise subscription contracts, cloud computing, and advertising monetization, rather than the 1999-style valuations built on phantom metrics like “price per thousand clicks” or the “eyeball economy.”
Furthermore, there is a structural signal being underestimated by the market— Breadth expansion. The primary forces driving the S&P 500 over the past 12 months have indeed been highly concentrated in the Magnificent 7. However, since the first quarter of 2026, small-cap stocks and individual stocks in non-core AI sectors have also begun to participate in this rally. In contrast, the end of the Dotcom era in 1999 was characterized by the opposite—the higher the index rose, the fewer companies participated. The current breadth characteristics are closer to 1995 to 1996 —and that bull market continued for another four years after 1995.
Based on the above analysis, the interim conclusion of this article is: Current U.S. stock valuations are expensive, but the structure is not a bubble; the market is at a high level, but it is likely not the peak. However, “not a bubble” does not mean “no risk.” A reversal in sentiment often happens in an instant and requires not a rational reason, but merely an explainable one.
3. Four Short-Term Risks Severely Underestimated by the Market
Before diving into specifics, it is necessary to establish a fundamental understanding: A market decline never needs a “rational” reason; it only needs an “explainable” one. This is also why, even if fundamentals continue to improve, sentiment-driven pullbacks can still occur at any time.
Risk 1: Concentrated IPOs of Three Tech Giants; the Liquidity Siphon Effect is Seriously Underestimated
The most underestimated risk for the second half of the year in the market currently is three tech giants—OpenAI, Anthropic, and SpaceX—with a combined valuation approaching $4 trillion, are queuing for concentrated IPOs .
SpaceX targets a valuation as high as $1.75 trillion, with planned fundraising exceeding $75 billion. Its S-1 filing was secretly submitted on April 1, 2026, under the internal codename “Project Apex.” Roadshows are scheduled to start the week of June 8, with the prospectus expected to be public by late May (Source: Bloomberg, Reuters, CNBC, TechCrunch). If listed at a $1.75 trillion valuation, SpaceX would become the largest IPO in human history, directly shattering Saudi Aramco’s 2019 record of $29.4 billion and being nearly three times its size. OpenAI targets a valuation of $1 trillion and plans to go public in the fourth quarter of 2026. Anthropic targets a valuation of approximately $900 billion and plans to go public in October 2026. Combined, the three have a potential fundraising scale exceeding $240 billion—a figure that exceeds the total amount raised in the entire U.S. IPO market in 2025.
Ordinary investors might ask: What is the direct relationship between these IPO companies and the shares of Nvidia and Tesla they hold? The answer is that the relationship is extremely significant, hidden in two levels.
The first level: A zero-sum game of funding sources. Liquidity in the secondary market is finite. When a company with a trillion-dollar valuation undergoes an IPO, the most common choice for institutions to free up funds to subscribe for new shares is to sell off tech stocks that have already seen significant gains and are highly profitable. More critically, early-stage investors in the primary market seek large-scale exits at the time of the IPO—Microsoft, Khosla Ventures, and a16z behind OpenAI; major sovereign wealth funds, Sequoia, and Founders Fund behind SpaceX; Google and Amazon behind Anthropic—the purpose of these early shareholders entering the investment was, from day one, to exit through the IPO, the only large-scale monetization channel. After the lock-up period ends, these early shareholders will continue to reduce their holdings, and the capital taking over in the secondary market must ultimately be drawn from retail investors’ retirement accounts and institutional asset rebalancing. This selling pressure is not a one-off event; rather, it will persist in the form of a chain reaction for 12 to 24 months.
The second level involves a critical new rule implemented on May 1, 2026, but which the vast majority of retail investors are unaware of— — the Nasdaq “Fast Entry” new rule. Under this new rule, eligible large-scale IPOs can bypass the original year-long waiting period and be directly included in the Nasdaq 100 Index within just 15 trading days after listing, or approximately three weeks. The scale of the mandatory selling pressure hidden behind this rule is staggering: All passive funds tracking the Nasdaq 100, including ETFs like QQQ, QLD, and TQQQ with combined assets under management totaling hundreds of billions of dollars, must forcibly buy these newly listed stocks within three weeks. To make room for these positions, they must sell existing constituents proportionally. This is not a prediction, but a passive, regular, and institutional withdrawal of liquidity.
From a historical perspective, when Alibaba went public in 2014 and raised $25 billion, the Nasdaq Index fell by nearly 3% that week. What we are discussing today is more than ten times the scale of Alibaba back then, with three giants taking turns to debut in the second half of the year. When these “elephants” start collectively shifting chairs, the “small animals” nearby will inevitably be trampled. This is the core logic why shifting gears actively is worth serious consideration at this stage.
Risk Two: Driven by both consumer resilience and the wealth effect, the risk of secondary inflation is being overlooked by the market
The second risk is the possibility of an unexpected rebound in inflation in the second half of 2026. The mainstream market consensus holds that inflation is an old story from 2022, but if the latest data is deconstructed layer by layer, the logic of returning inflation is exceptionally clear.
In JPMorgan’s Q1 2026 earnings report, CEO Jamie Dimon issued an important warning: consumer spending and small business activity remain robust, with consumption growth “faster than the same period last year” . Even as Brent crude has surpassed $110 per barrel, credit card spending and retail expenditures show no signs of slowing down. JPMorgan’s explanation is: energy spending accounts for only 3% of a typical U.S. consumer’s budget, therefore even if oil prices double, it will not be enough to substantially suppress total consumption.
But this is precisely the heart of the problem. The fact that oil prices cannot crush consumption means that terminal demand will not automatically cool down; and without cooling demand, elevated upstream costs can only be passed through to the downstream price system via corporate price hikes—transportation, manufacturing, raw materials, and agricultural products will all be affected. A more subtle long-term driver is the “
wealth effect “. Over the past 24 months, the S&P 500 has surged nearly 50%, which has had a very significant stimulative effect on the consumption of the wealthy. The top 20% income bracket in the U.S. accounts for more than 40% of the country’s total consumer spending. When the wealthy feel their paper assets are continuously appreciating, their willingness to spend on discretionary consumption such as dining, travel, and luxury goods increases significantly, which happens to be the stickiest part of services CPI. Combining these forces creates a “vicious cycle” that makes core CPI difficult to lower. Once the CPI in a given month unexpectedly jumps from the market’s expected 2.8% to the 3.3% range, all current market expectations for Fed rate cuts in the second half of the year will be instantly shattered. Much of the logic supporting current high market valuations is built on the assumption that “the Fed will cut rates twice more this year.” Once this premise is broken, all high-valuation growth stocks will undergo a simultaneous re-pricing of valuations.
The first signal could appear as early as July or August 2026 —this could be a CPI reading that beats expectations or Fed officials turning hawkish; either would be enough to trigger a reversal in sentiment. Risk Three: The change in Fed leadership and independence risks
The third risk is occurring this month.
Jerome Powell’s term as Fed Chair officially ends on May 15, 2026; the new Chair, Kevin Warsh, was approved by the Senate Banking Committee with a 13-11 vote on April 29 and is about to face a full Senate vote and take office. On the surface, this is a routine personnel change, but it affects one of the most important institutional foundations of global financial markets over the past 40 years— the independence of the Federal Reserve . The market’s biggest concern right now is not who the new Chair is, but whether the incoming Chair will deviate from the traditional, data-driven monetary policy framework under political pressure and become a “mouthpiece for the government.” Once the market forms this perception, even if economic data does not deteriorate in the short term, the U.S. dollar, Treasuries, and all risk assets will be forced to re-price—the market will demand a higher risk premium, which directly corresponds to a compression in equity valuations. The market may only truly begin to digest this risk between June and July, following the new Chair’s first policy statement, first FOMC meeting, or Congressional testimony.
Risk Four: Policy uncertainty from the midterm elections
The fourth risk is the November 2026 midterm elections. For the market, “not knowing who will win” is itself the greatest risk.
August through October is typically the window of highest market volatility in election years —the historical average of the VIX during this period is significantly higher than in the same period of non-election years. The peculiarity of midterm election risk is that it acts more like an emotional catalyst, rather than a substantive fundamental shock. Its real role is to provide a “justifiable” reason for a downturn at a critical moment for a market already on edge due to IPO liquidity drains, rebounding inflation, and the change in Fed leadership. 4. Response Framework: Three Practical Operating Principles
Given that this is not currently a bubble but there are four short-term risks lying in ambush, how should investors proceed? The following three practical principles are for your reference:
Defend, Wait, and Shift . First, taking profits is not the same as liquidation.
The most common cognitive trap for novice investors is simplifying decisions into a binary choice of “all-in” or “all-out.” This is like eating at a buffet, where you either gorge yourself or leave hungry just to lose weight—neither is the optimal solution. The correct approach is to first put a plate of the most valuable food into your stomach; if you still want to eat, you can always return to the table. In terms of operation, this means actively reducing positions in some of the most extreme trending stocks at their peaks while keeping a core position to maintain exposure to the long-term AI narrative. The AI story still holds, but the collapse of short-term cost-effectiveness should not be ignored. One investment rule worth remembering is: “Before the money is in your pocket, those are just flashing numbers on an account, not real assets” . Second, absolutely do not chase highs at current levels.
For investors who haven’t entered the market over the past six months and have watched optical modules rise 200%, chips rise 150%, and memory stocks rise 700%, the most important thing right now is to stay calm. The U.S. stock market never lacks opportunities, but what is most scarce is the discipline to wait patiently amidst a frenzy. Fighting for a measly 5% profit at the peak while bearing the risk of a potential 30% drawdown—this risk-reward ratio is clearly unfavorable. As long as you remain patient enough, The market will likely offer a more cost-effective second entry point during the volatility of summer and autumn 2026 .
Third, allow capital to seek new opportunities through sector rotation. Cash from profit-taking should not sit idle in accounts. The eternal truth of the market is “ sector rotation” — a hot sector today may freeze tomorrow; an overlooked corner today often hides tomorrow’s surprises. True long-term alpha always comes from positioning at lows rather than chasing at highs.
5. Directions wrongly punished by market panic: Application-layer software stocks
The direction truly worthy of focus and research right now is the one being directly hit by the “ SaaSpocalypse (the SaaS doomsday theory)” macro narrative — namely, application-layer software stocks.
Data suggests the intensity of this sector rotation has been rare over the past decade. The software ETF (ticker: IGV) has fallen approximately 30% cumulatively since peaking in September 2025; meanwhile, the semiconductor ETF (ticker: SMH) has risen about 30%. A 60-percentage-point divergence between the two is extremely rare in the history of the US stock market over the last ten years .
The trigger for this extreme sentiment was the release of general-purpose AI workflow products such as Anthropic’s Claude Cowork and OpenAI’s Frontier Agent. The market’s gut reaction is that since AI Agents can complete end-to-end workflows, the value proposition of traditional SaaS companies will be fundamentally disrupted. However, this conclusion is half right and half wrong. The correct part: Single-function, pure-utility SaaS indeed faces immense survival pressure. The incorrect part: Large-scale SaaS platforms with deep customer data assets, deep integration into enterprise workflows, and compliance/security moats will actually become more valuable due to AI empowerment—because they serve as the indispensable intermediary layer between AI Agents and real-world enterprise business data.
The following representative tickers are for logical illustration only and do not constitute buy recommendations:
Salesforce(NYSE: CRM) — The stock price has fallen approximately 30% over the past 12 months. While the market fears AI will replace CRM software, its FY2026 Q4 earnings report showed 12% year-over-year revenue growth, and its core AI product Agentforce annualized revenue has surpassed $800 million, representing a 169% year-over-year growth rate. This demonstrates that its customer data assets and workflow integration are insurmountable moats in the AI era.
Adobe(NASDAQ: ADBE) — Its forward P/E ratio is currently around 12x, compared to a five-year average of 30x—valuation has been slashed to the bone. Market panic stems from the rise of generative AI tools like OpenAI’s Sora and Midjourney, but enterprise customers haven’t churned en masse. If large language models become the unified interface for computer operation in the future, Adobe’s creative engine will likely be invoked more frequently—evolving from a manual tool into the foundational infrastructure for LLMs to generate professional-grade, compliant content.
ServiceNow(NYSE: NOW) — The P/E ratio has compressed from 67x to 28x, a valuation cut of nearly 60%. However, rigid enterprise demand for process automation has actually accelerated due to AI adoption— ServiceNow’s latest earnings show subscription revenue still maintaining year-over-year growth of over 20% , with no signs of being replaced by AI.
Atlassian(NASDAQ: TEAM) — Down nearly 60% YTD, hit hard by the narrative that “seat-based pricing models will be destroyed by AI.” However, the FY2026 Q3 earnings report released on April 30, 2026, directly refuted this narrative: total revenue grew 32% year-over-year to $1.8 billion, cloud revenue growth accelerated to +29% (reaching $1.13 billion), and remaining performance obligations (RPO) increased 37% year-over-year to $4 billion, Net Revenue Retention remained above 120% and has risen for several consecutive quarters— the gold standard for measuring SaaS customer health, indicating that existing customers are still expanding their spending (Source: Atlassian Q3 FY2026 8-K, SEC).
Most notably, while retail investors are still panic-selling software stocks, Wall Street sentiment has quietly shifted. Research heads from JPMorgan, Goldman Sachs, and Morgan Stanley all stated publicly during the Q1 2026 earnings season that the current sell-off in software stocks is overdone. Even Nvidia founder Jensen Huang explicitly stated in public that the argument “AI will completely replace software” is illogical. Yet, these views are not yet fully reflected in stock prices—which is the very definition of “opportunity.”
The core message is: When everyone is frantically chasing hot stocks that have already pulled forward future growth, true alpha is often hidden in corners unfairly punished by panic. However, it must be emphasized again that the above is for research purposes only and does not constitute investment advice.
6. Conclusion
The eternal iron law of the market is: No asset can go straight up at a 90-degree angle. Such mania is always the result of resonance between fundamentals and sentiment—fundamentals may persist, but sentiment will inevitably reverse. If signals emerge such as a significant decoupling of Big Tech capital expenditure growth and revenue growth, a notable widening of credit spreads, or the 10-year US Treasury yield breaking 5.5%, the current assessment in this article would flip, and the appropriate response would shift to a fully defensive stance. This article is for sharing analytical logic and thought processes only and does not constitute investment advice—every investor is responsible for their own capital. The assets and viewpoints mentioned herein should not be directly copied; ultimate decision-making power always rests with the investor .