


After years of uncertainty caused by the global pandemic, rising interest rates, tighter credit, and changing remote-work trends, evidence increasingly indicates that the U.S. commercial real estate (CRE) market is beginning to recover. Although headlines often focus on struggling office buildings in major cities, a closer examination of market fundamentals suggests an optimistic outlook. For example, the Vanguard Real Estate Index Fund (VNQ), a popular exchange-traded fund (ETF) with over 160 holdings across sectors like industrial, retail, and other CRE areas, has increased by 7.9% year-to-date as of May 31, 2026. Although recovery differs across sectors, many are experiencing real improvements in occupancy, leasing activity, investment inflows, lending volumes, and property values.
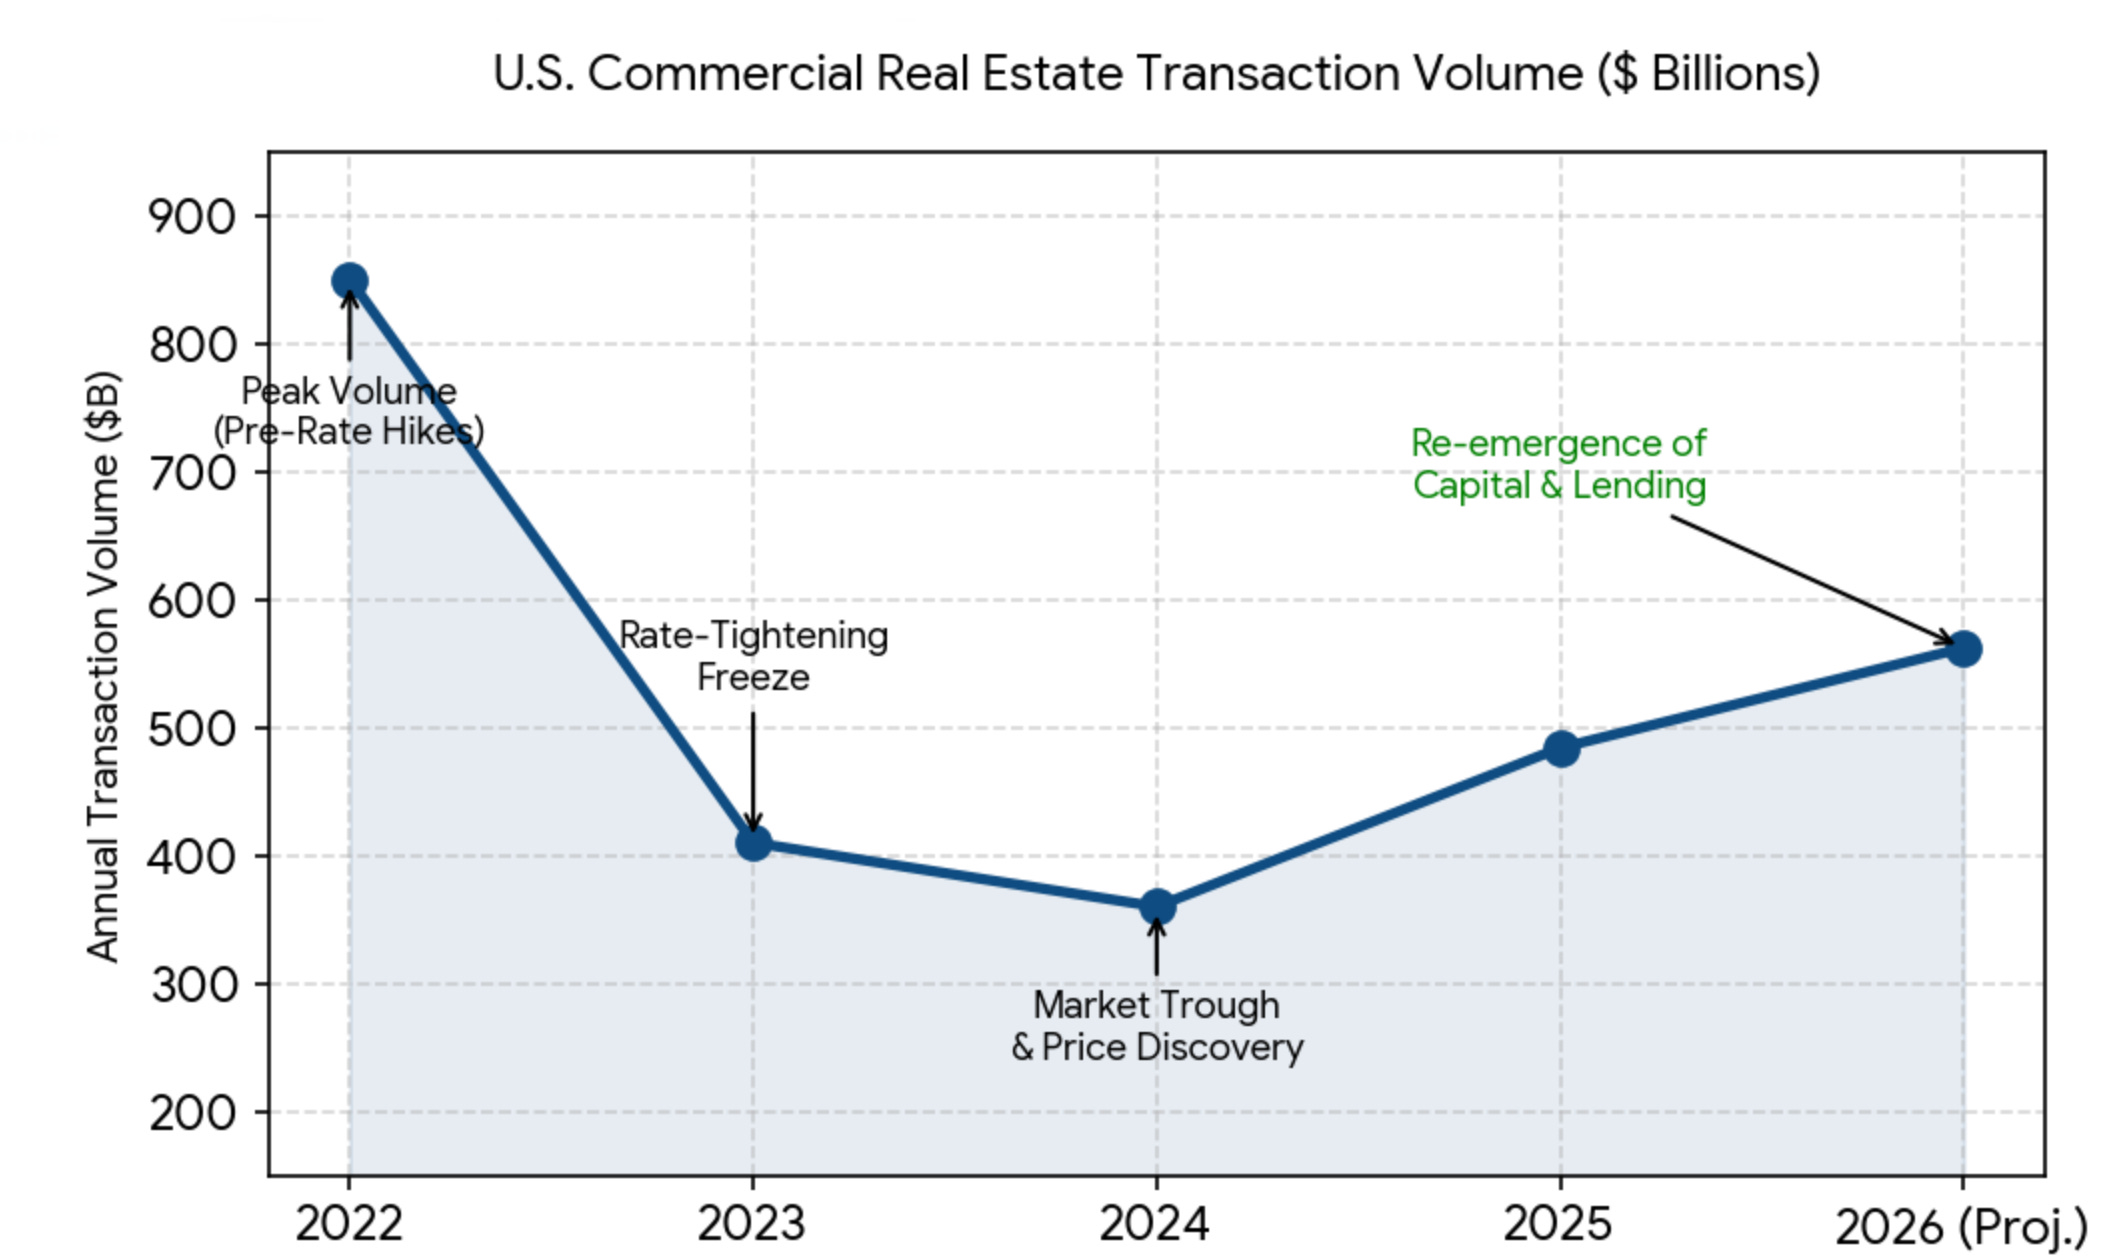
Additional evidence of this recovery comes from the resurgence of transaction activity and lending volumes. During the Federal Reserve’s aggressive interest-rate-tightening cycle from 2022 to 2024, commercial property transactions slowed dramatically as buyers and sellers struggled to agree on valuations. Higher borrowing costs reduced purchasing power and heightened uncertainty about future property values. However, as of late 2025 and into 2026, transaction activity has improved.
Source: A&M Advisory Real Estate Advisory Services and MSCI Real Assets
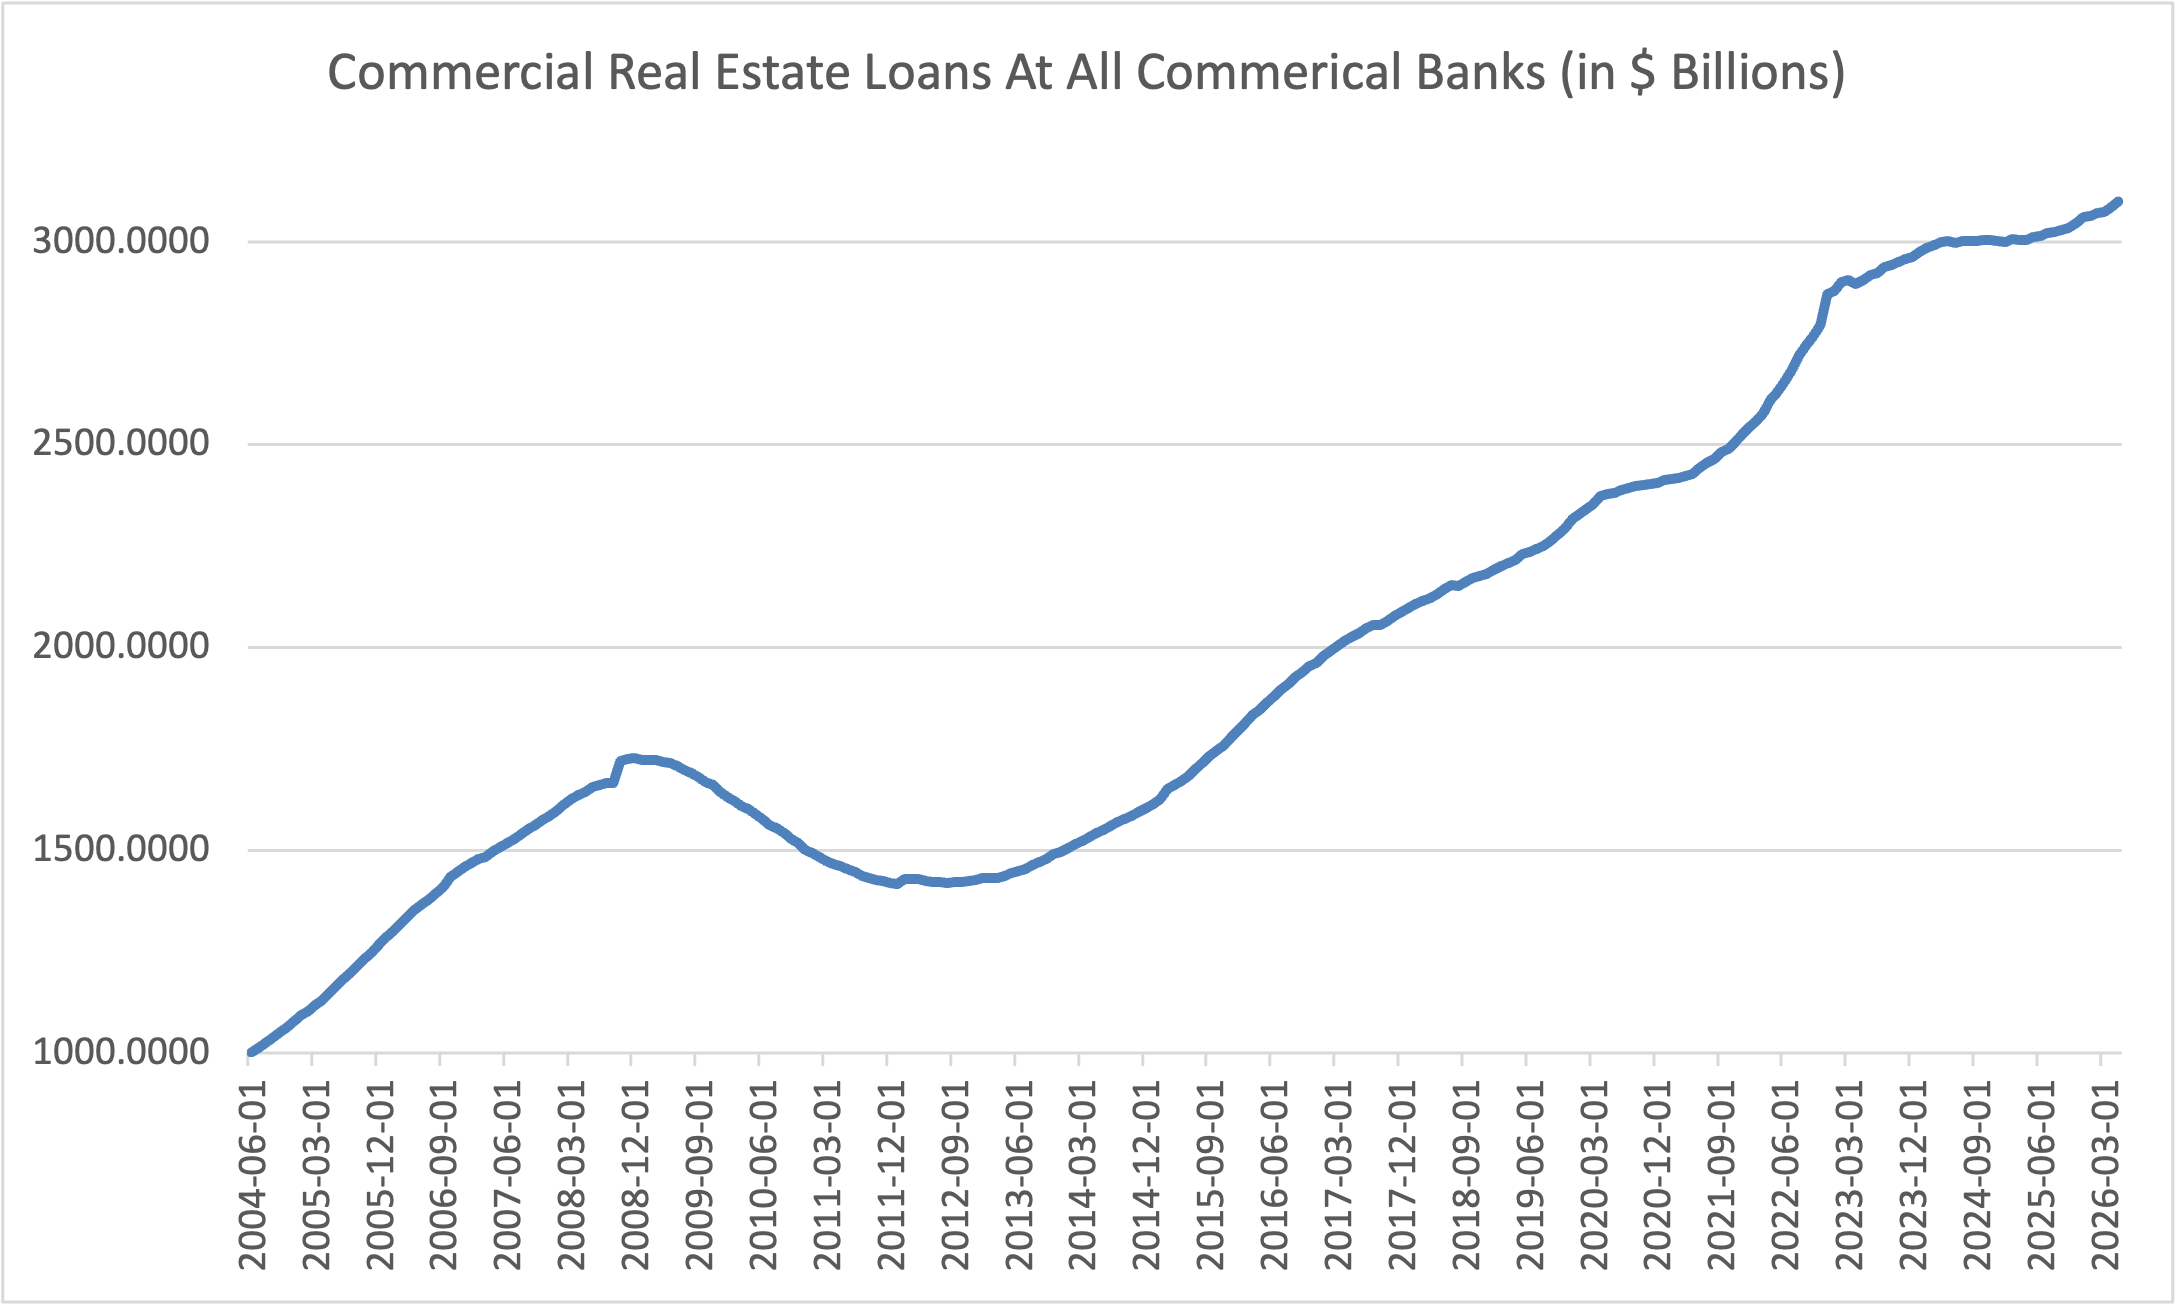
Industry forecasts indicate that U.S. CRE transaction volume will rise significantly in 2026, while lending activity has rebounded sharply as banks, insurers, private lenders, and debt funds return to the market. The return of capital is often one of the earliest signs of a sector’s recovery, as investors typically deploy capital only when they believe valuations have stabilized, and future returns justify the risks.
Source: Board of Governors of the Federal Reserve System
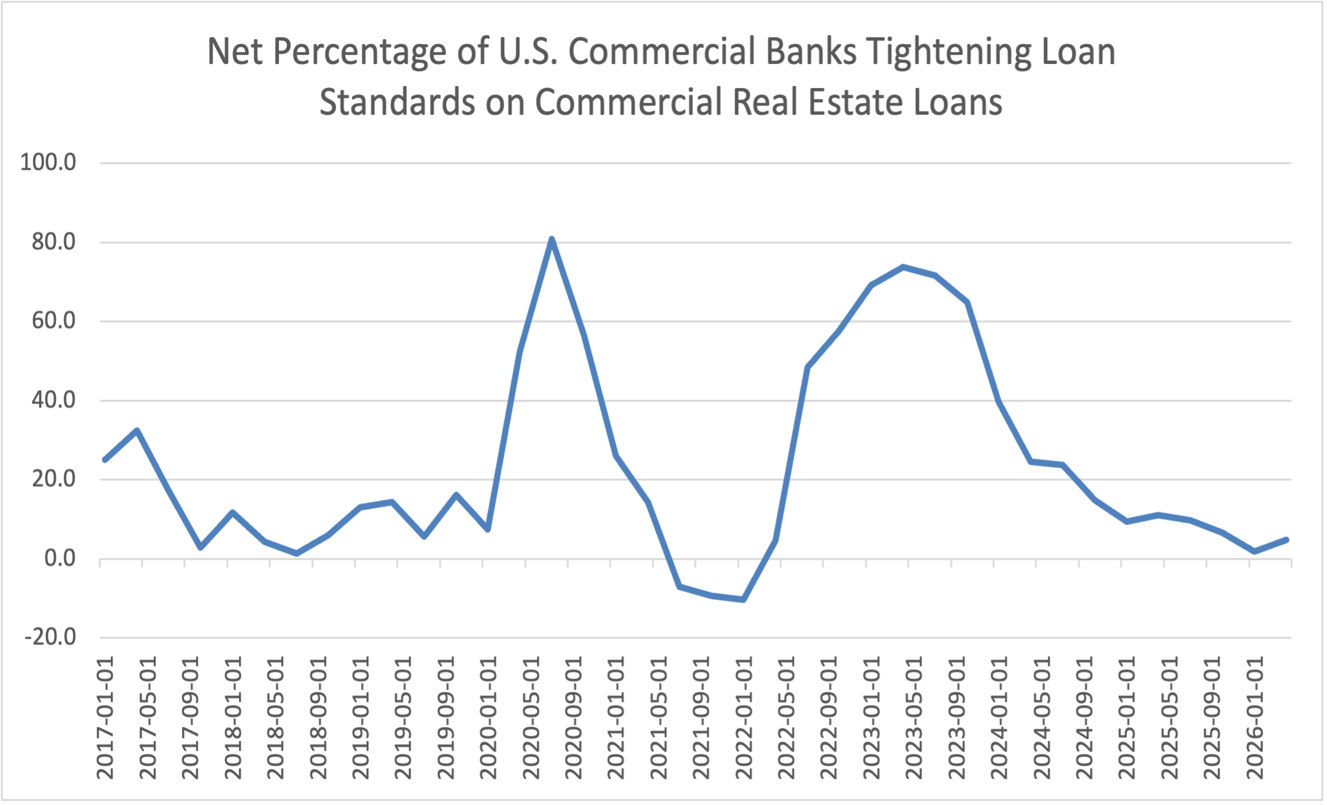
Another important metric tracks the behavior of commercial banks toward CRE-related activity, namely the net share of banks that have tightened their loan standards in this sector. This barometer has plunged to levels seen before the global pandemic.
Source: Board of Governors of the Federal Reserve System
Another important metric to track is the capitalization rate, commonly known as the cap rate. Cap rates reflect the relationship between a property’s net operating income and its market value. During the interest rate shock from 2022 through 2024, cap rates rose significantly as investors viewed this sector as risky and demanded higher returns to compensate for higher borrowing costs and risk. Rising cap rates generally correspond to falling property values. More recently, however, cap rates have begun to stabilize and, in some markets, to compress modestly. This stabilization suggests that investors increasingly believe commercial property values have reached or are approaching a bottom. Historically, cap rate stabilization has often preceded broader market recoveries.
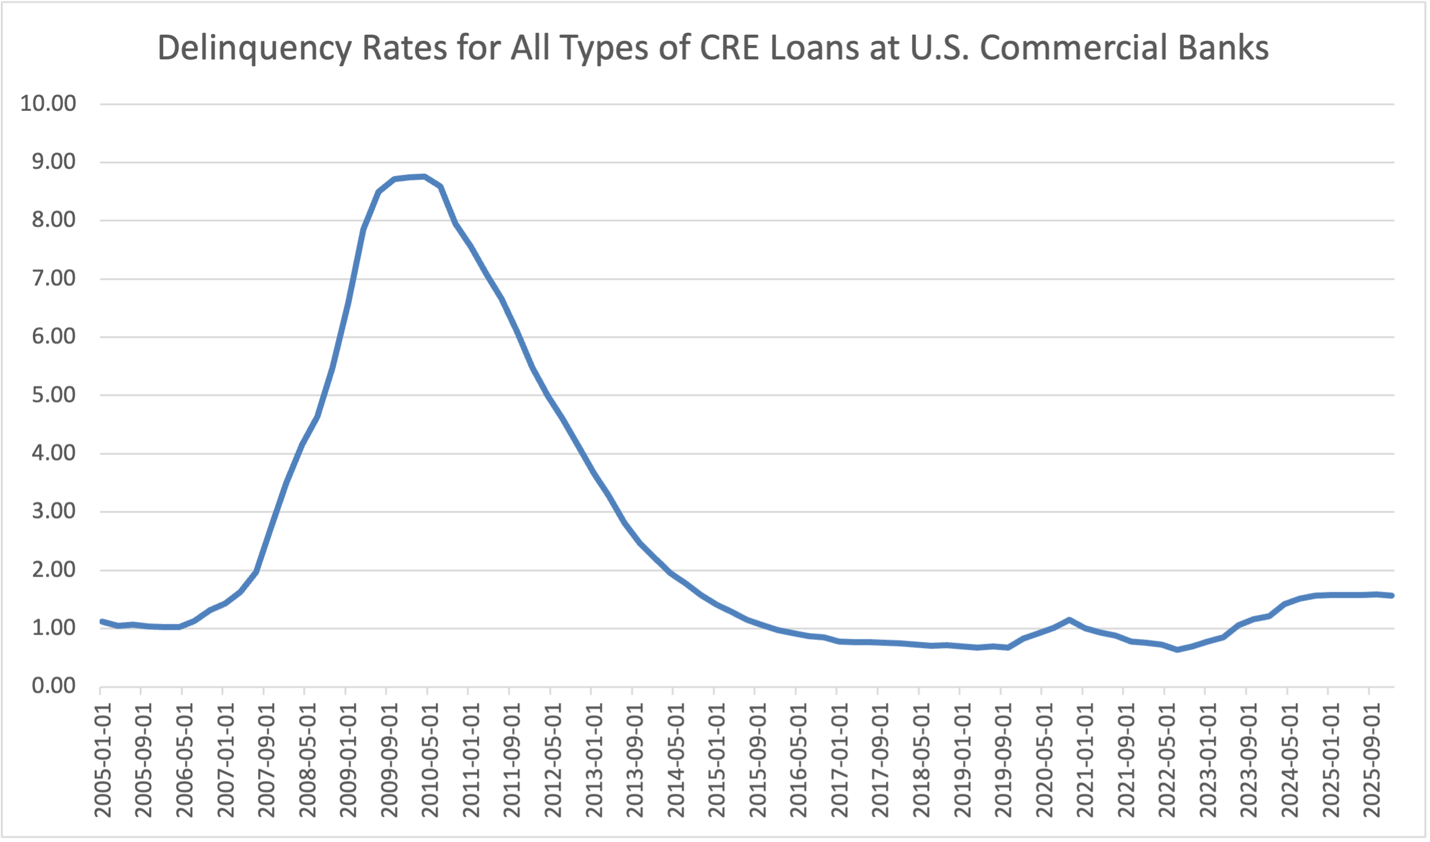
Commercial mortgage-backed securities (CMBS) delinquency rates also provide insight into the health of the market. While delinquency levels remain elevated in some property sectors, particularly office buildings, the rate of deterioration has slowed considerably. In certain segments, delinquency rates have begun to improve. This indicates that the industry’s distress cycle may have peaked. While not every troubled property will recover, the reduction in new distress signals indicates that many owners and lenders are successfully working through refinancing challenges and property repricing.
Source: Board of Governors of the Federal Reserve System
Net Absorption Rates
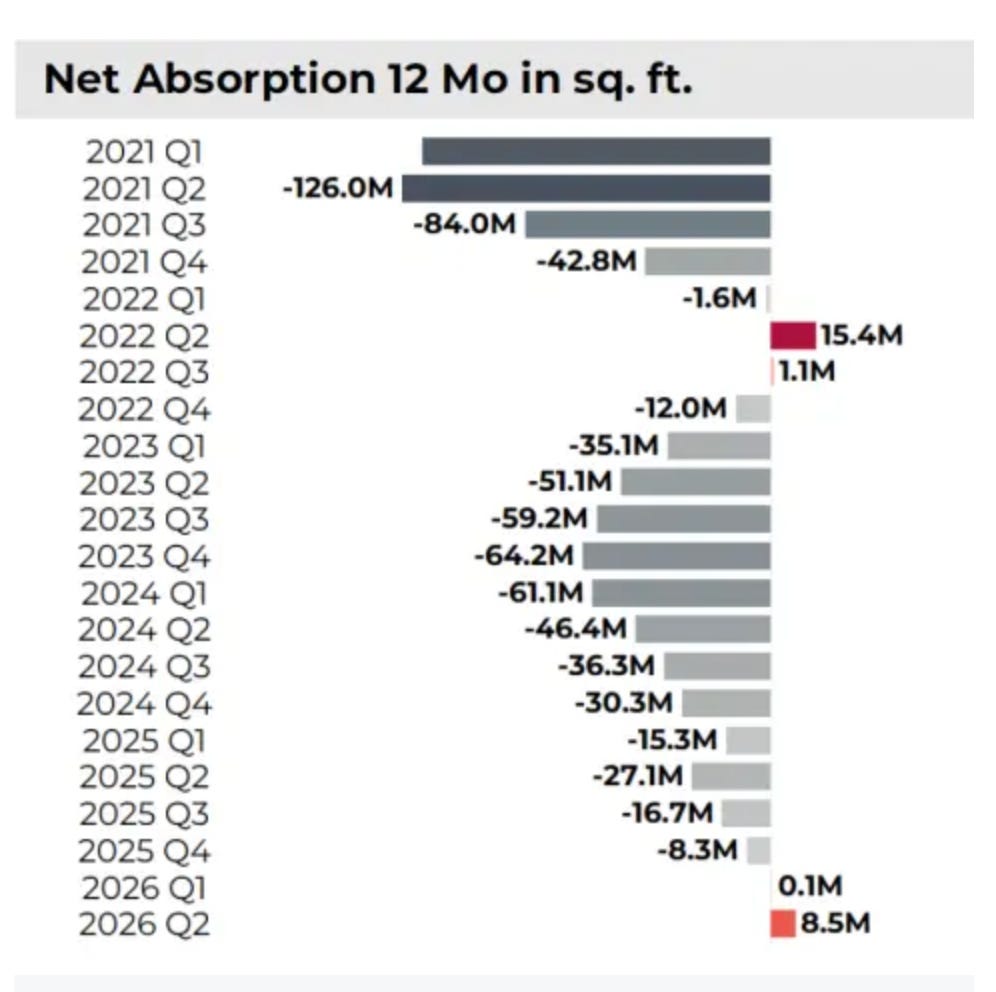
Perhaps the most important operational metric in commercial real estate is net absorption, which measures the amount of occupied space gained or lost over a period by subtracting the square footage vacated from the square footage newly occupied. Positive net absorption indicates expanding tenant demand and increasing occupancy. Negative absorption indicates shrinking demand.
Office Sector
Although the office sector remains the most challenging and controversial part of the commercial real estate landscape, we are seeing some early signs of recovery. National office vacancy rates remain elevated compared with pre-pandemic levels, but net absorption has turned positive in several major markets. Cities such as New York and San Francisco have recently reported occupancy gains after years of decline. However, describing the office market as a single sector can be misleading. The market has effectively split into multiple tiers.
High-quality Class A and trophy office buildings located in desirable business districts are benefiting from what industry analysts call a “flight to quality.” Companies that require office space increasingly prefer newer buildings with modern amenities, energy efficiency, flexible layouts, and attractive locations that help attract employees back to the workplace. These premium properties are experiencing improved occupancy, rising rents, and positive absorption.
Meanwhile, many older Class B and Class C office buildings continue to struggle. These properties often face persistent vacancies, declining rents, and significant refinancing challenges. In some cases, they may eventually require conversion into residential, mixed-use, or alternative property types. Consequently, while the office market is recovering in aggregate, the recovery remains uneven and selective.
Net Absorption Rates in the CRE Office Sector
Source: National Association of Realtors
Retail Sector
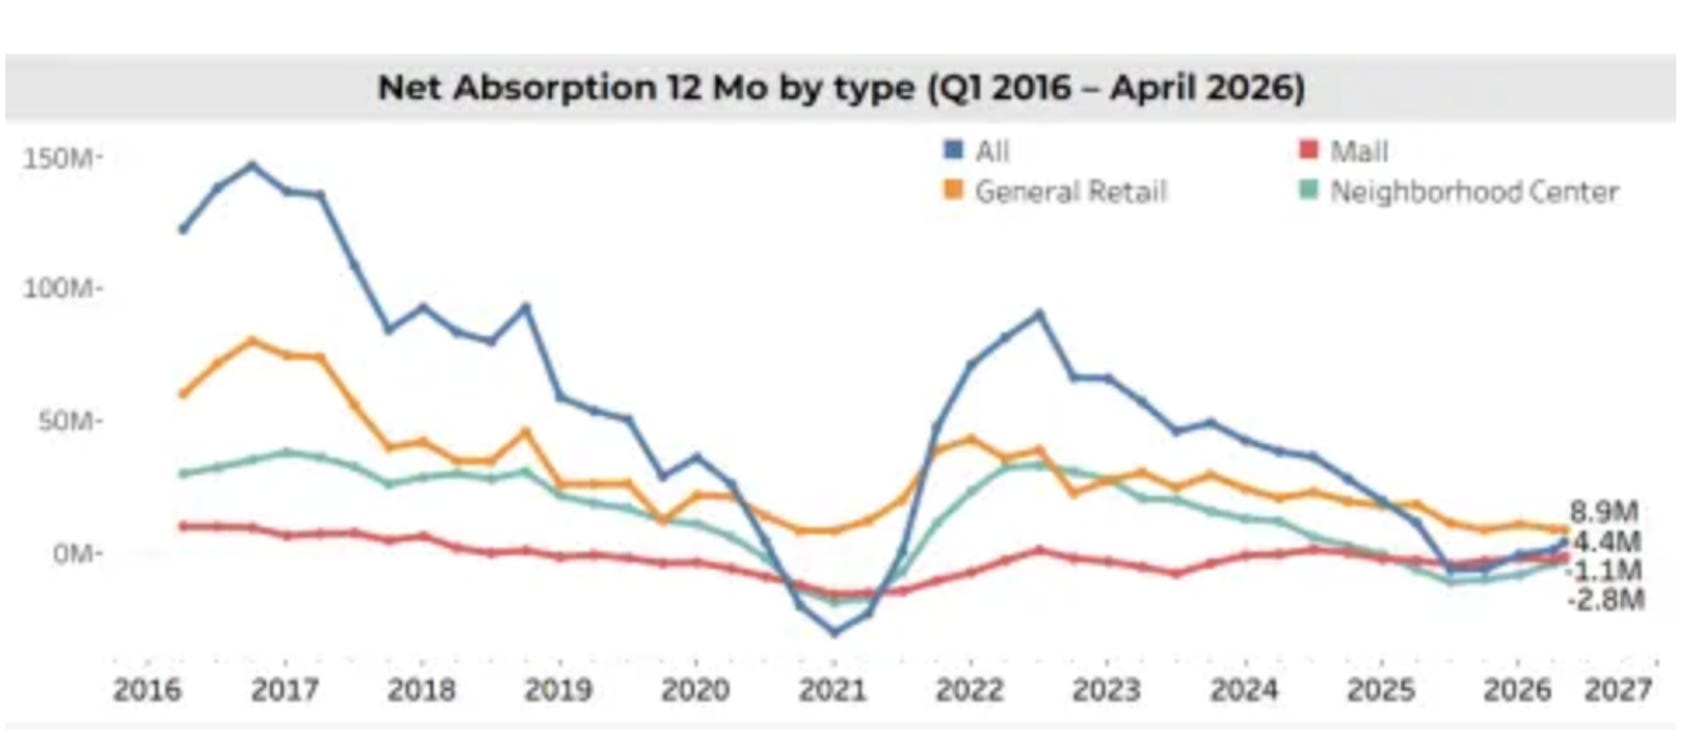
Retail real estate has emerged as an unexpected success story in the post-pandemic era. For years, many analysts predicted that online shopping would permanently weaken physical retail. However, net absorption in retail has stayed relatively stable, and vacancies are near historic lows. A key reason is that very little new retail space has been built over the past decade. These supply constraints have enabled existing shopping centers to maintain healthy occupancy rates even as some individual retailers have closed. Grocery-anchored centers, discount retailers, restaurants, healthcare tenants, and experiential businesses continue to drive demand for retail space. As a result, retail property owners in many markets have maintained pricing power and achieved steady rent growth.
Net Absorption Rates in the CRE Retail Sector
Source: National Association of Realtors
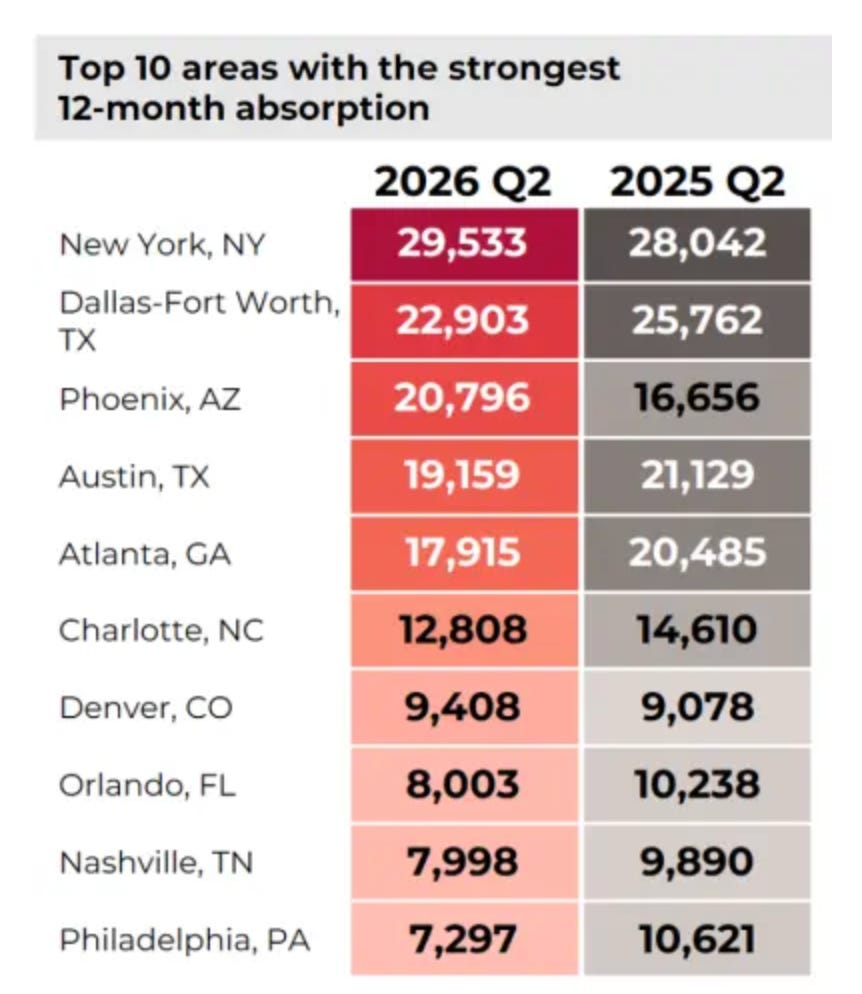
Multifamily housing has shown signs of improvement after a period when a large wave of newly completed apartment units temporarily created an oversupply. Absorption has strengthened significantly. New apartment construction is slowing, while household formation and rental demand remain relatively healthy. In many markets, net absorption has turned positive, stabilizing vacancy rates and supporting rent growth.
Net Absorption Rates in the CRE Multi-Family Housing Sector
Source: National Association of Realtors
Industrial Sector
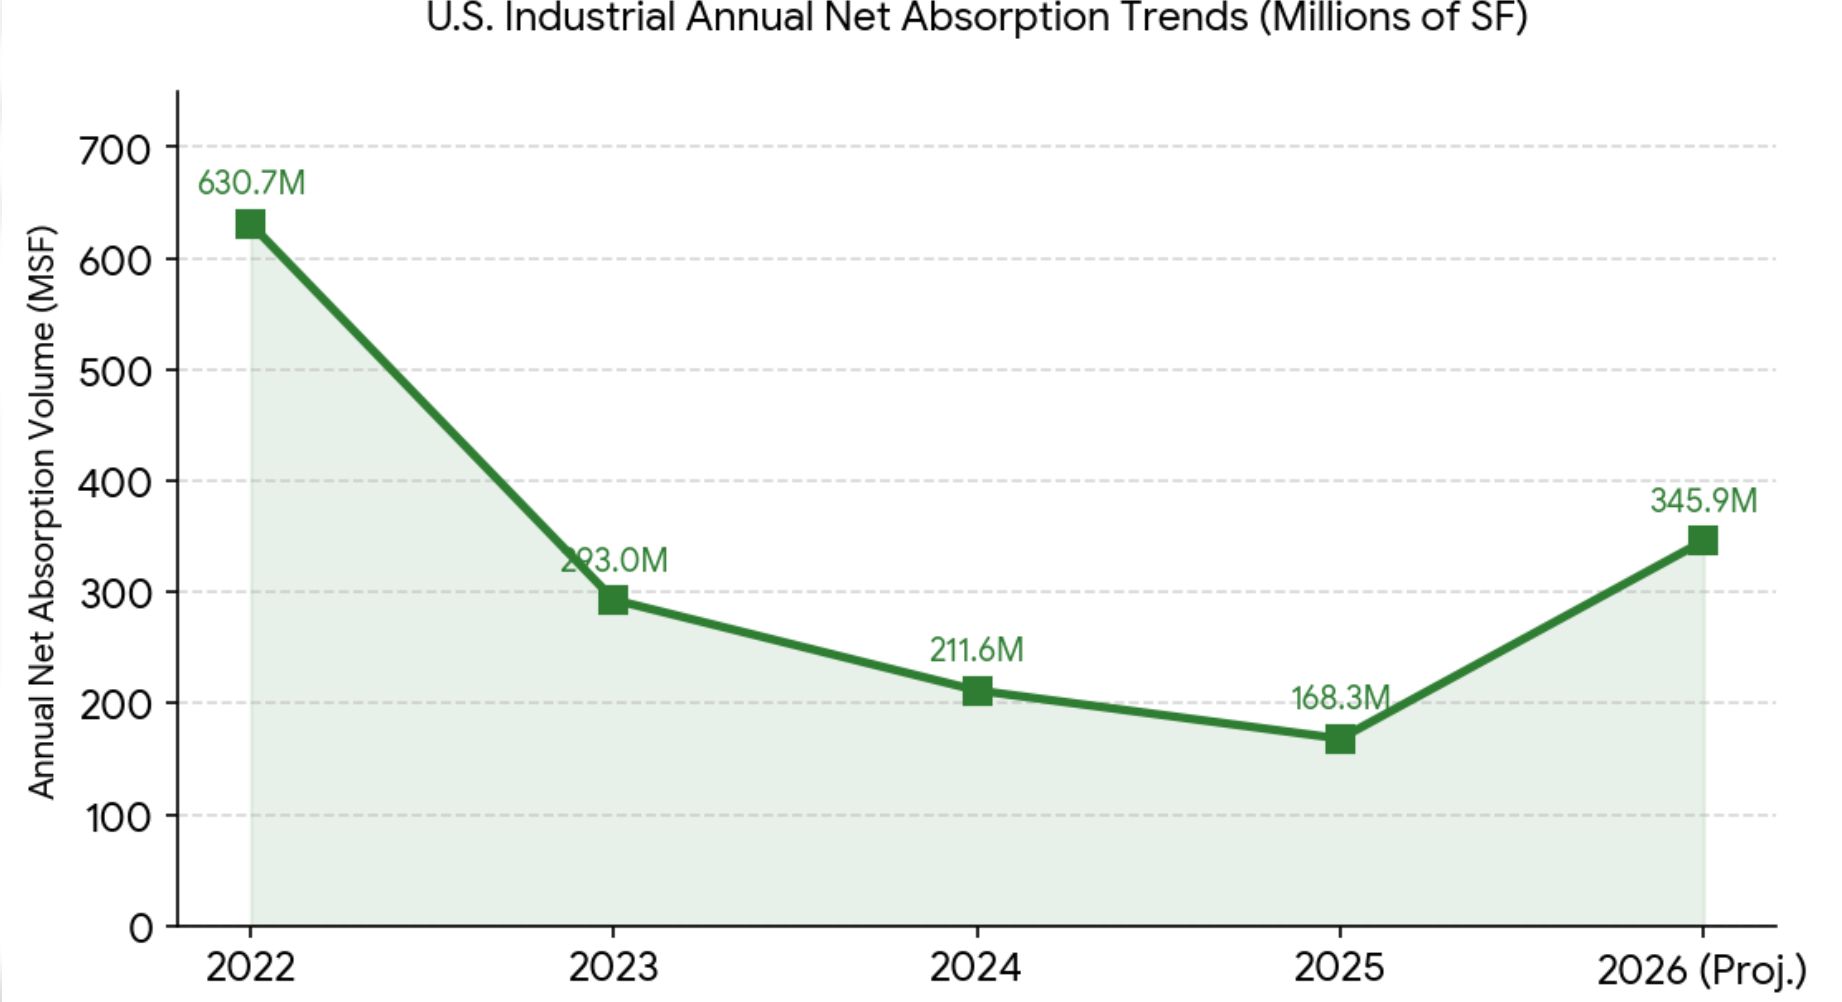
Industrial real estate has shown particularly great improvement. After an extraordinary boom during the pandemic-driven e-commerce expansion, the industrial sector experienced a temporary slowdown as supply caught up with demand. However, recent data indicate industrial net absorption has accelerated once again. Demand is being supported by continued growth in e-commerce, supply chain restructuring, inventory management needs, and a growing trend toward domestic manufacturing and reshoring.
Source: NAIOP Research Foundation
Data Centers
This sector holds a unique place in commercial real estate. Historically, it was considered part of industrial properties due to their warehouse-like appearance. However, today most institutional investors and brokerage firms categorize data centers as a separate asset class or as components of the broader digital infrastructure sector.
This category represents the fastest-growing segment of the CRE sector within the United States. Cloud computing, artificial intelligence applications, machine learning, streaming services, cybersecurity requirements, and the broader digitalization of the economy are driving demand. Unlike traditional property sectors that measure occupancy in square feet, data center demand is often measured in megawatts of power capacity.
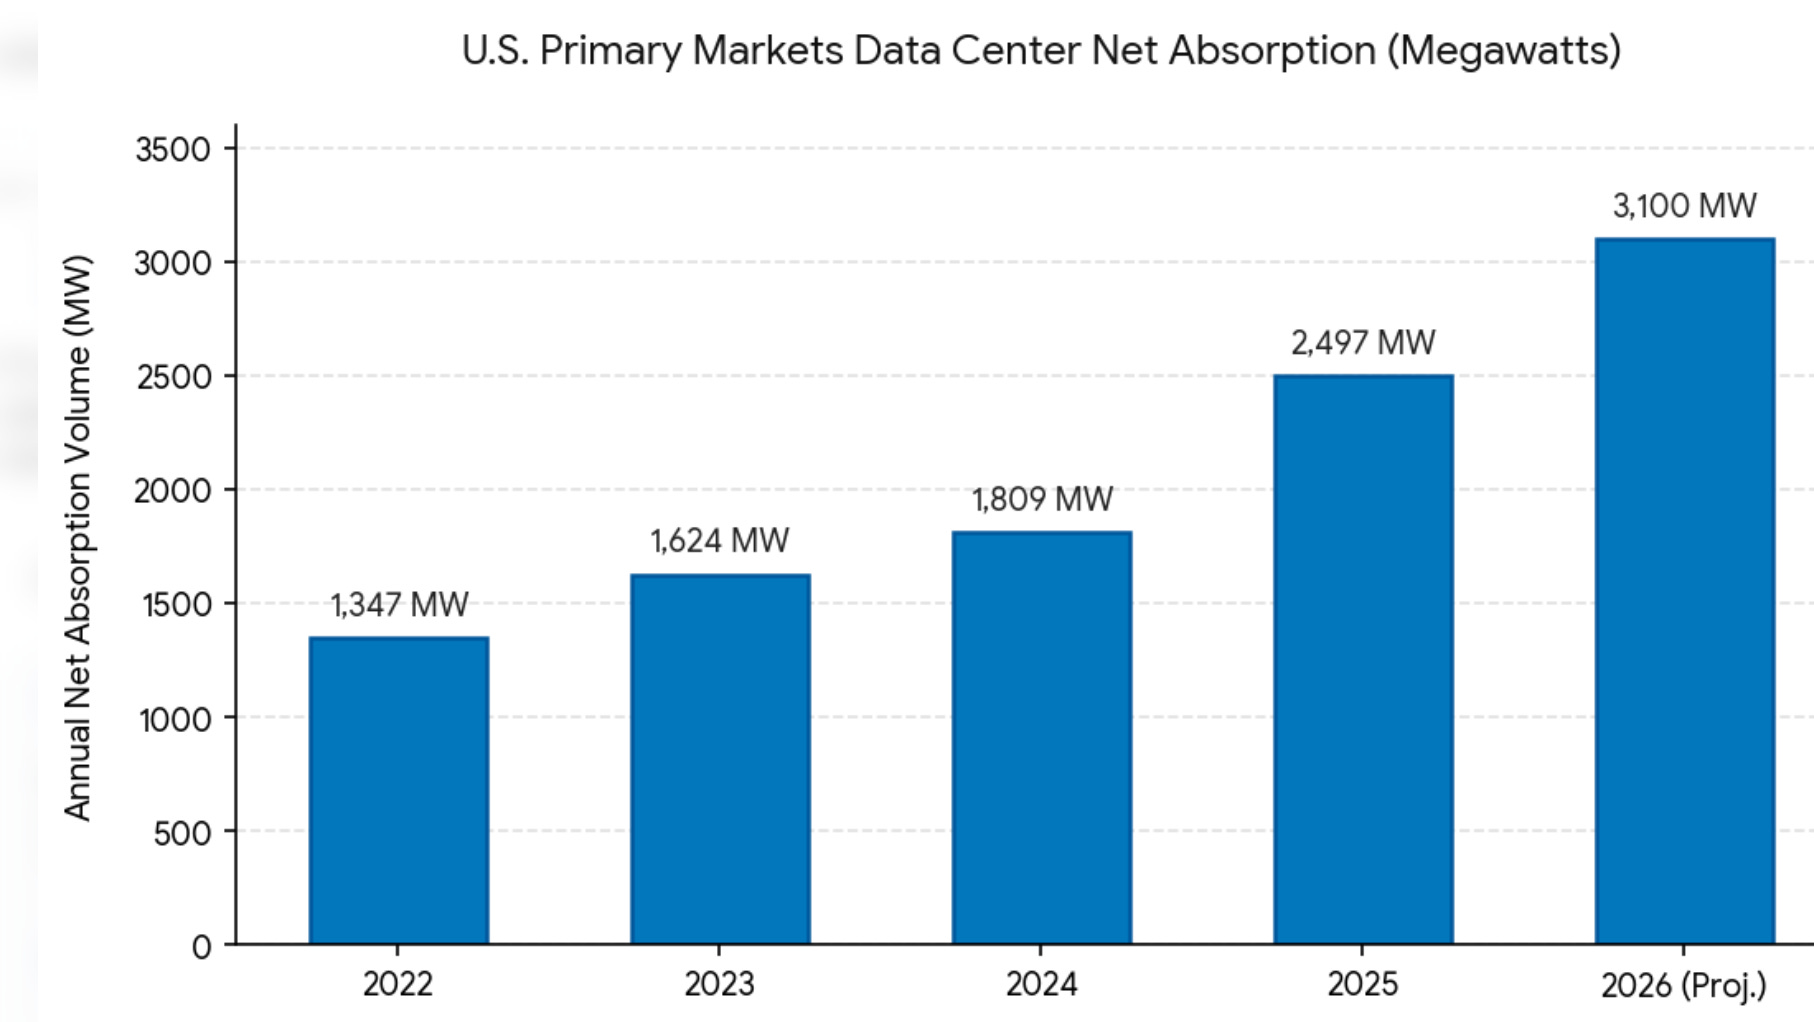
Source: CBRE Research
Recent absorption figures for data centers have reached record levels. In many major markets, including Northern Virginia, Dallas, Phoenix, Atlanta, and Chicago, developers are struggling to build capacity fast enough to satisfy tenant demand. A significant percentage of projects under construction are already pre-leased before completion. Vacancy rates remain exceptionally low, and rental rates continue to rise.
Still, data centers face a critical problem, namely, a lack of energy to power the leased and expected capacity in the United States. In 2025, the sector leased more than 15 gigawatts of capacity, with most of it scheduled to come online in late 2026 and 2027. As a helpful reference, a large nuclear reactor can generate about 1,000 megawatts (1 gigawatt) of electricity, enough to power 750,000 U.S. homes. That means that leasing 15 gigawatts in 2025 would be equivalent to 15 nuclear reactors powering up to 11.3 million U.S. homes.
Industry sources (e.g., Sightline Climate’s tracker) indicate that only about 5 gigawatts of the 16 gigawatts leased in the 2026 pipeline are under construction, even though typical build timelines range from 12 to 18 months! This suggests a stark 3:1 gap between commitments and actual capacity. That gap suggests that to meet this surge in capacity, the sector will need to secure additional power from all energy sources (e.g., oil, natural gas, and renewables). Traditional energy sources, such as oil and natural gas, will likely be insufficient to meet this demand. Unfortunately, most subsidies for alternative energy have been reduced or eliminated, and regulatory roadblocks have been imposed.
Summary of Data Center Activity (in Gigawatts)
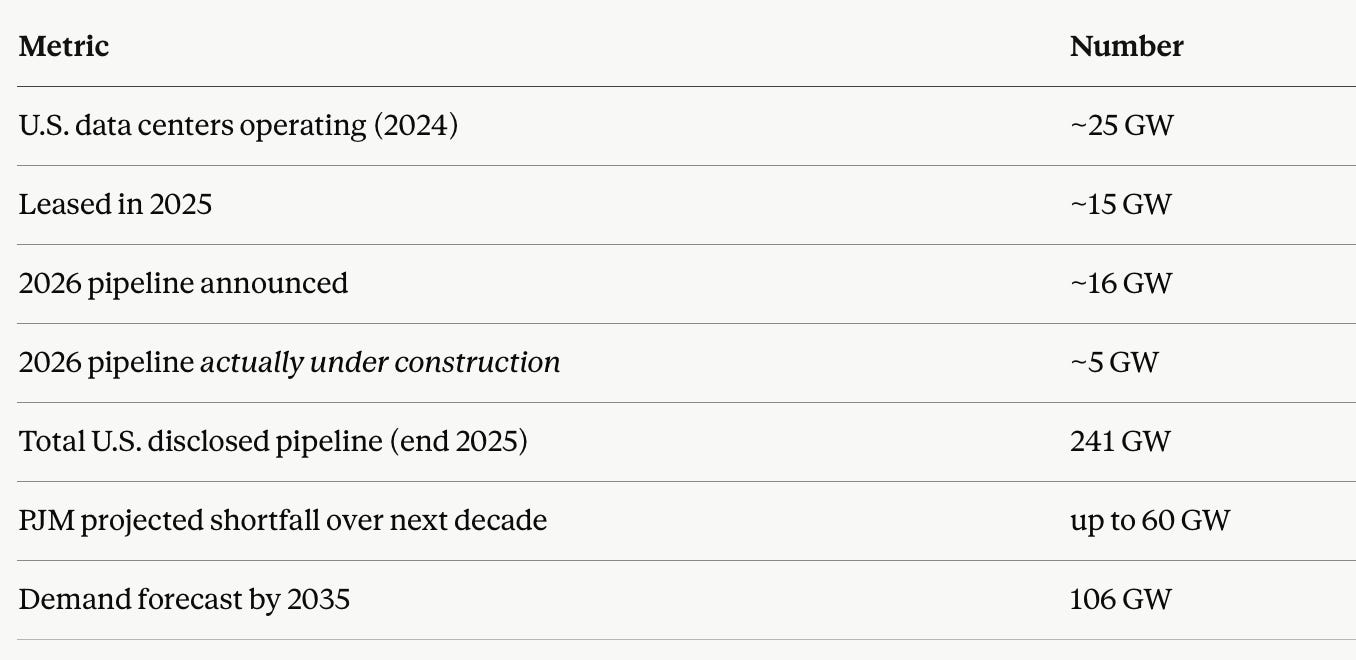
Source: Bloomberg (1,000 megawatts equals one gigawatt)
Macroeconomic Factors Impacting CRE
Another factor supporting the CRE outlook is the sharp decline in new construction across multiple sectors. Higher financing costs have been a negative headwind for the sector. However, while this factor may appear negative at first glance, it is helping existing properties by limiting future supply competition. As fewer new buildings enter the market, demand can gradually absorb available vacant space. This dynamic will be particularly beneficial for retail, industrial, and multifamily sectors.
The outlook for interest rates under Federal Reserve Chair Kevin Warsh will likely play a major role in determining the pace of commercial real estate’s recovery. Warsh as we have discussed in a prior Substack article, has emphasized productivity growth, technological innovation, and balance sheet normalization as key components of monetary policy. Many market participants now believe the era of near-zero interest rates is unlikely to return. Instead, investors and property owners increasingly appear to be accepting a “higher-for-longer” interest rate environment as the new normal.
For commercial real estate, this has both positive and negative implications. On the negative side, borrowing costs are likely to remain significantly higher than they were during the decade following the Global Financial Crisis. Refinancing challenges will persist for some property owners, particularly those holding weaker office assets or highly leveraged investments. On the positive side, stable interest rates can be more valuable than declining rates if they reduce uncertainty. Commercial real estate markets function more efficiently when investors can confidently estimate future financing costs. If inflation moderates and economic growth remains reasonably healthy, stable rates could encourage additional investment activity, lending, and transaction volume. Moreover, as property values adjust to the new interest rate environment, investors may increasingly view current valuations as attractive entry points.
Summary and Concluding Thoughts
Although the CRE good news remains selective rather than universal, the evidence shows that the sector is recovering. This is evident in the performance of data centers, industrial properties, retail centers, and multifamily housing. Office properties are improving, but only the highest-quality assets are seeing meaningful recovery. Key metrics, including positive net absorption, rising transaction volumes, increased lending activity, stabilizing cap rates, and improving delinquency trends, signal that the sector has moved beyond crisis and into a meaningful recovery.
The CRE story in 2026 is not one of a broad-based boom. Rather, it is a story of adaptation, repricing, and differentiation. The winners in the U.S. CRE space include properties that are favorably aligned with long-term economic and demographic trends, while those with weaker fundamentals continue to face challenges. However, compared with the uncertainty that dominated the CRE space just a few years ago, the direction of travel has become increasingly clear: much of the U.S. commercial real estate market is recovering, and in several sectors, the comeback is becoming quite impressive.