
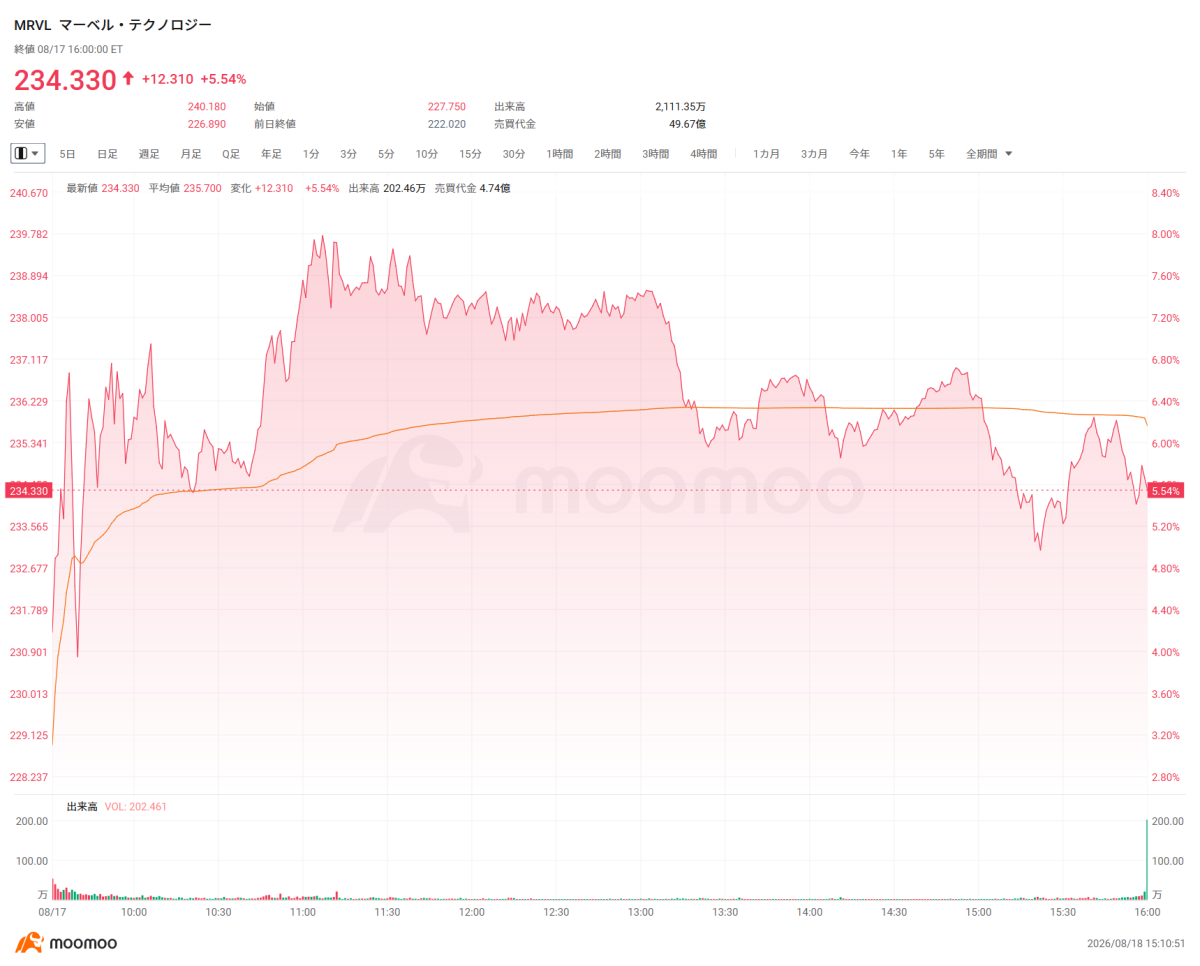
In the US market on the 17th, AI and semiconductor-related stocks held firm, confirming investors’ strong appetite for AI-related names.
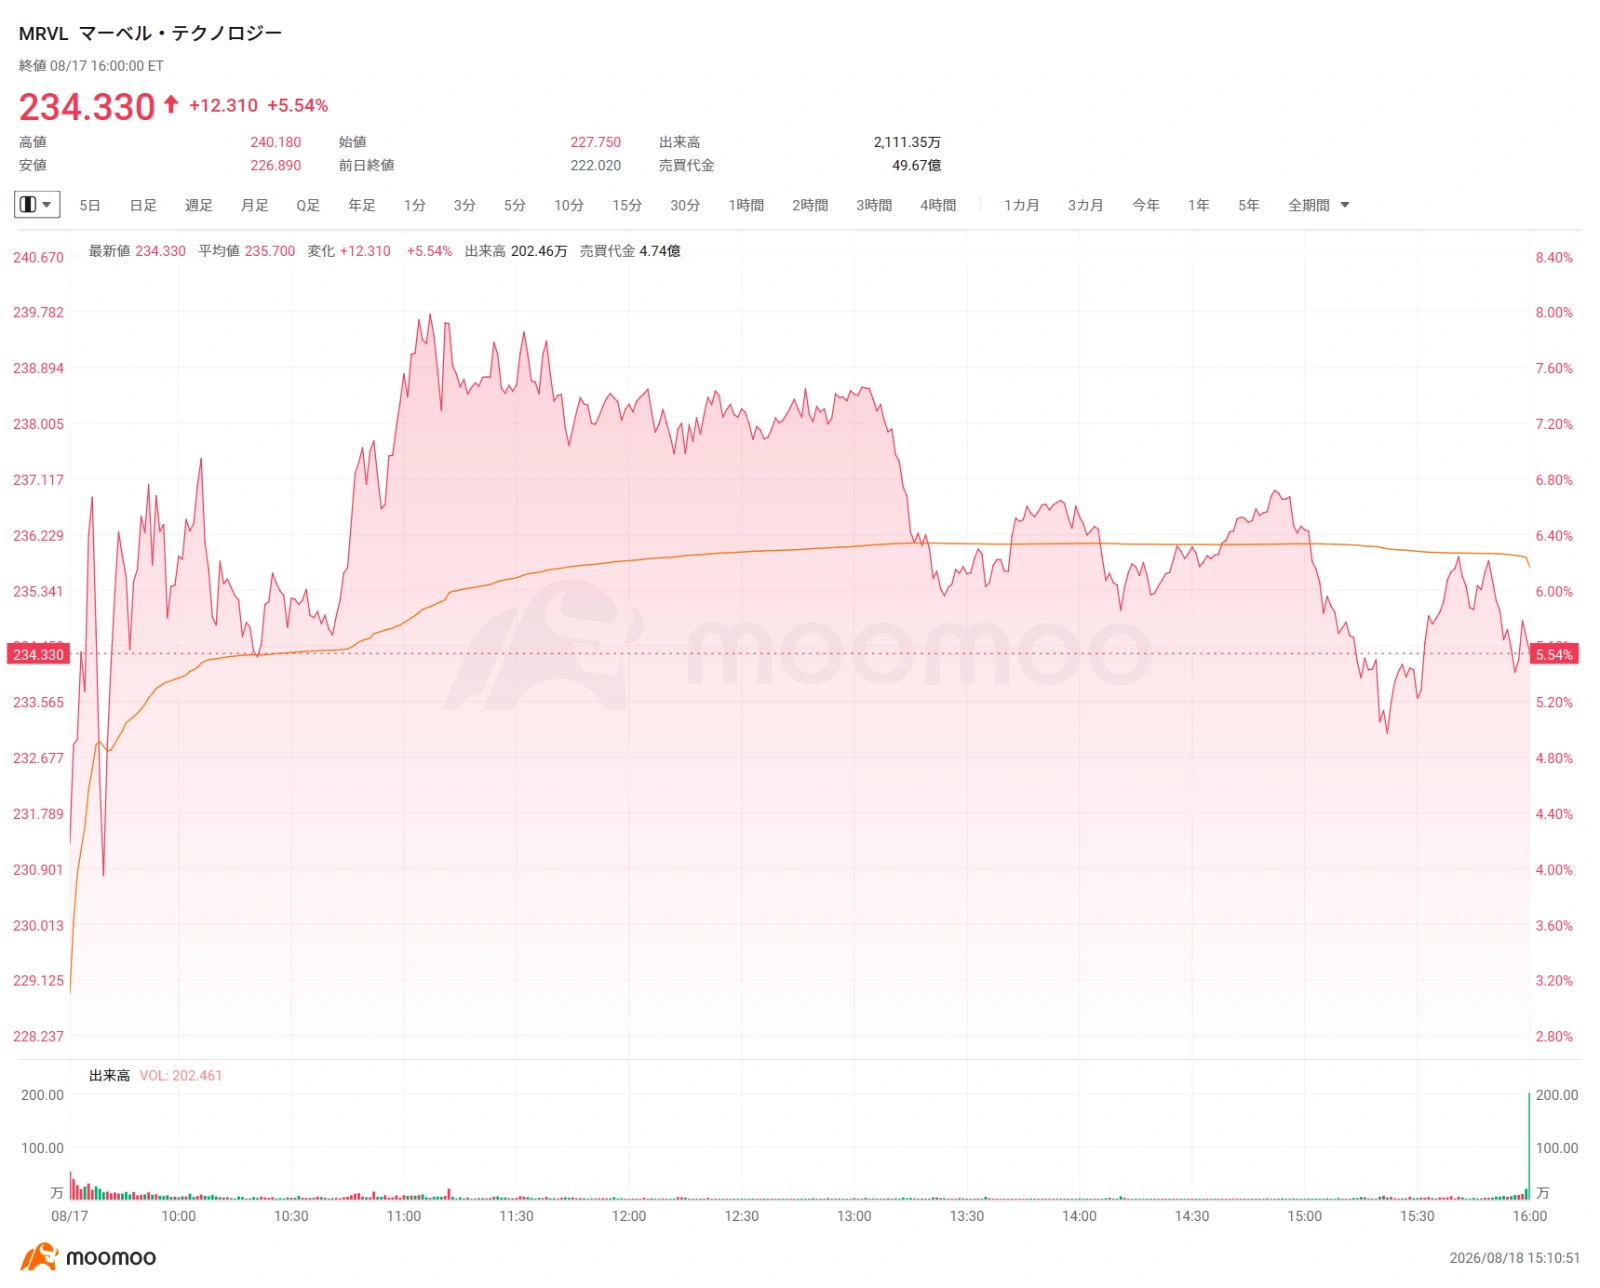
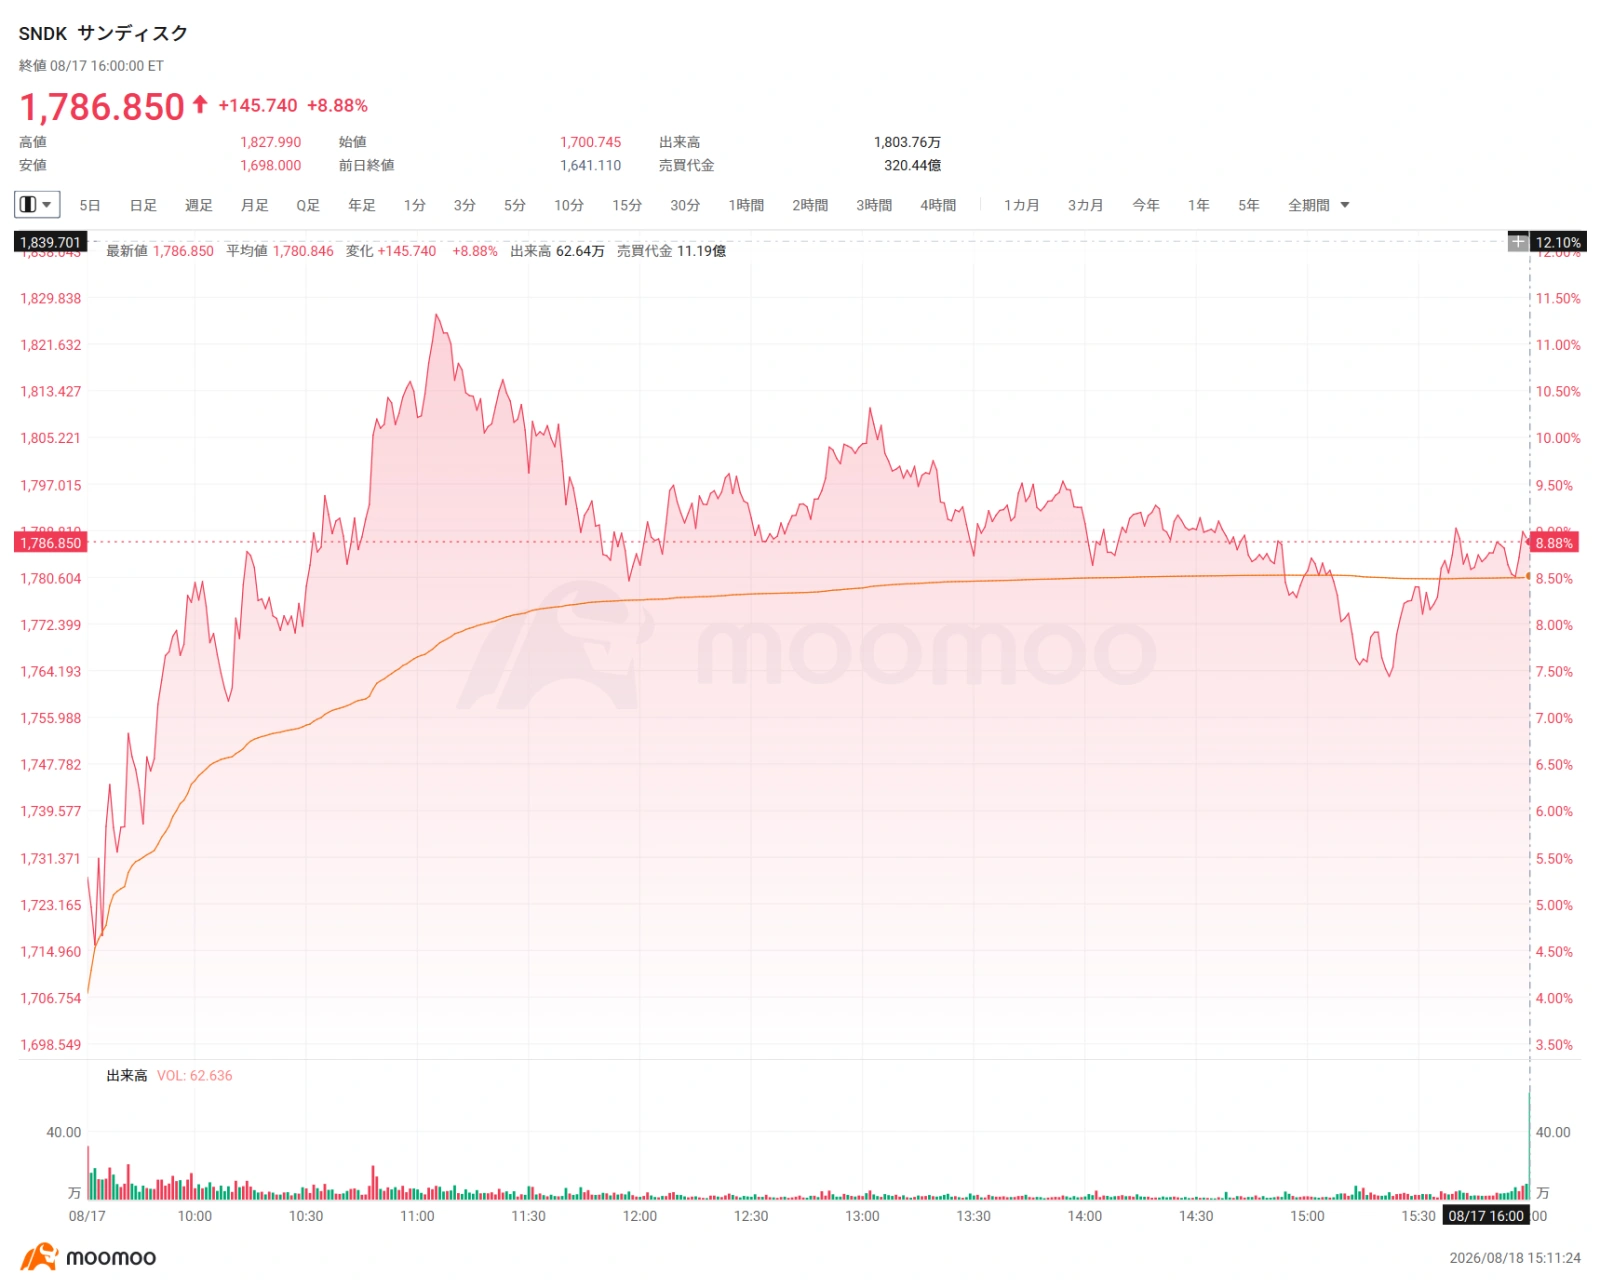
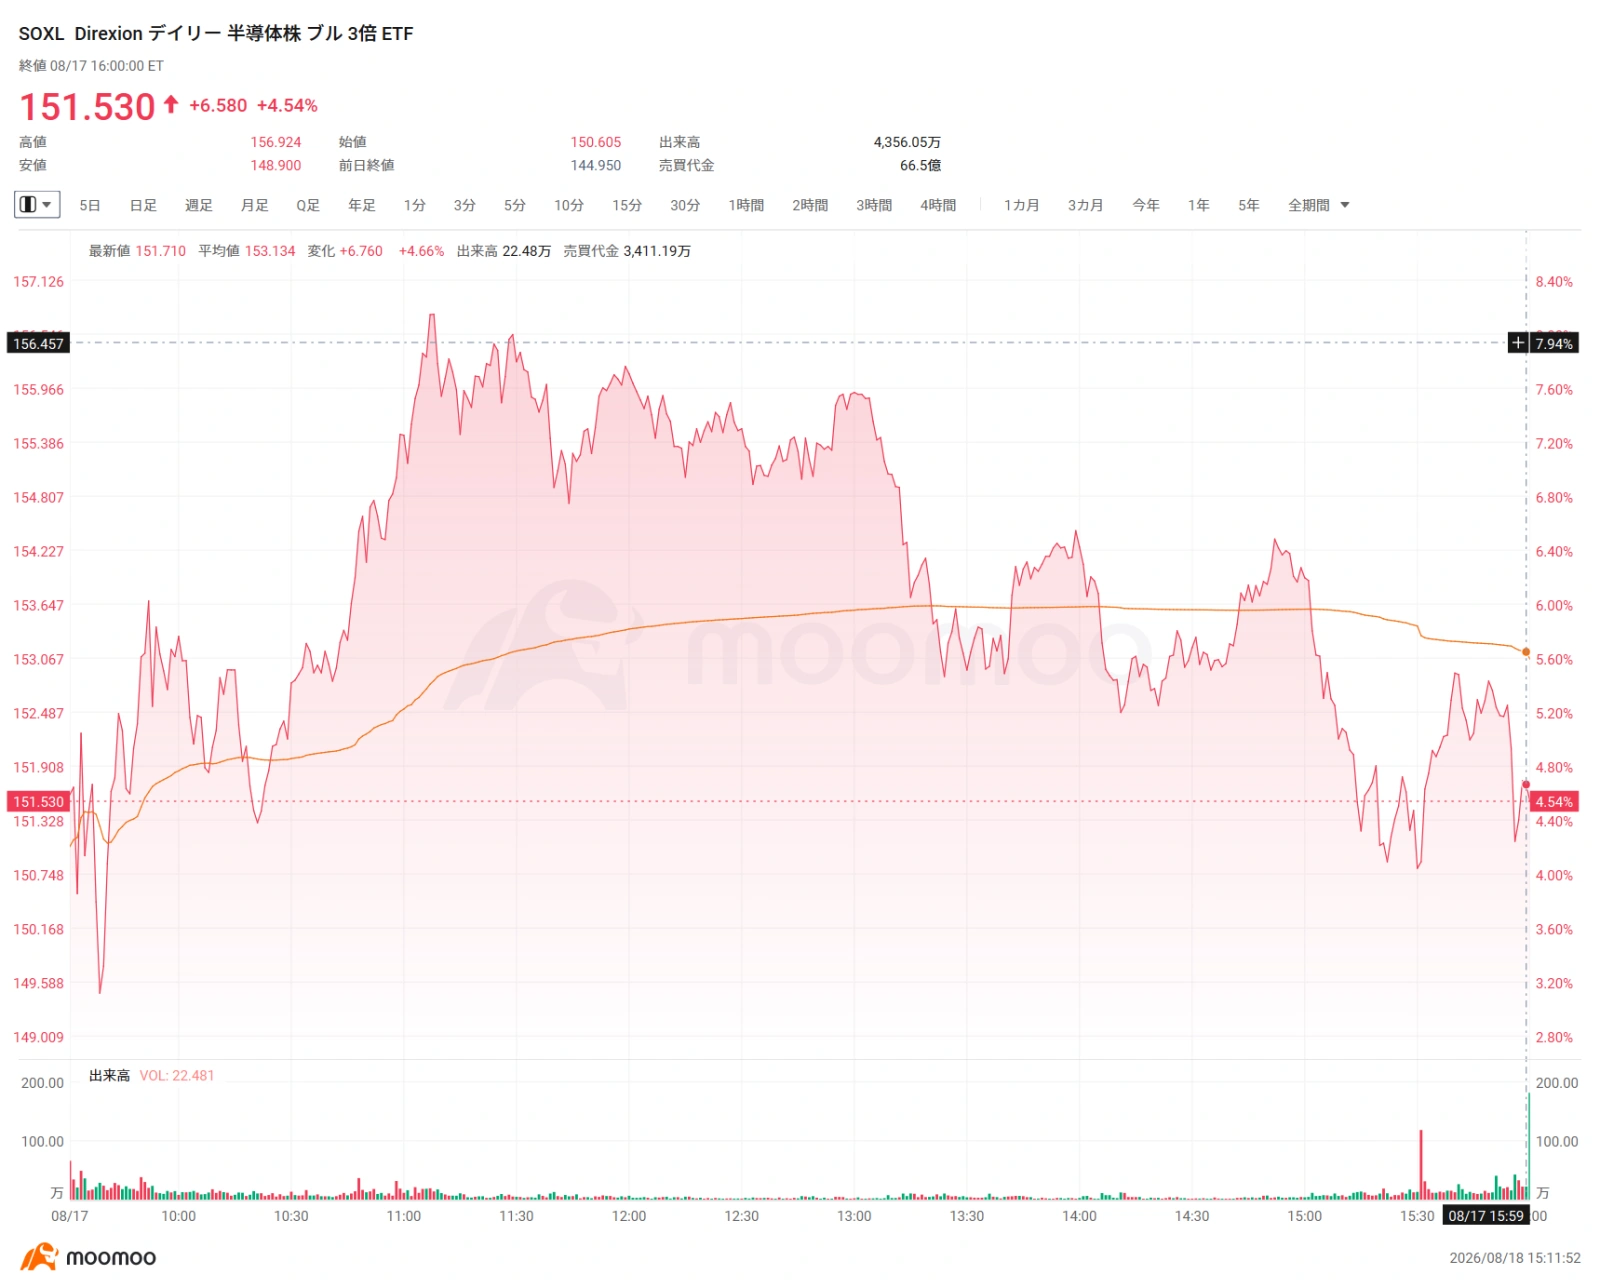
Additionally, new policy developments have emerged for memory stocks. Reports indicate that the Trump administration has urged Apple to avoid sourcing memory chips from Chinese memory companies such as CXMT and YMTC.
Thus, while these three stocks have risen on the same AI capital expenditure theme, significant differences are evident in the risks priced into the options market.
MRVL — IV uplift leading up to earnings
$Marvell Technology (MRVL.US)$ In the options market for [MRVL], pricing of event volatility is progressing ahead of the August 27 earnings release.
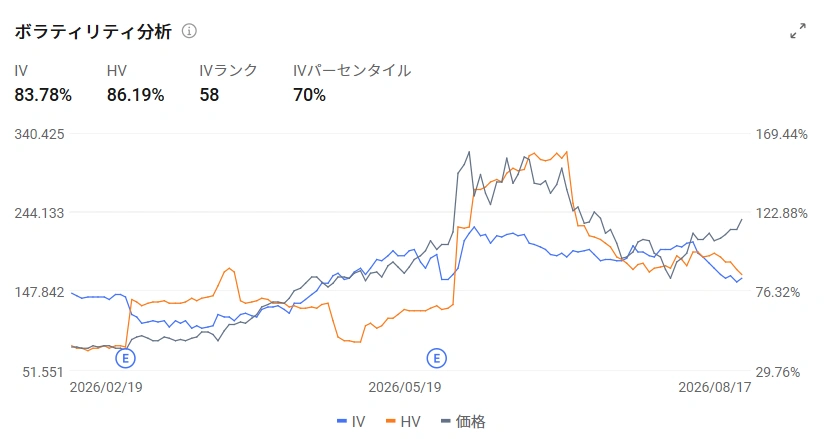
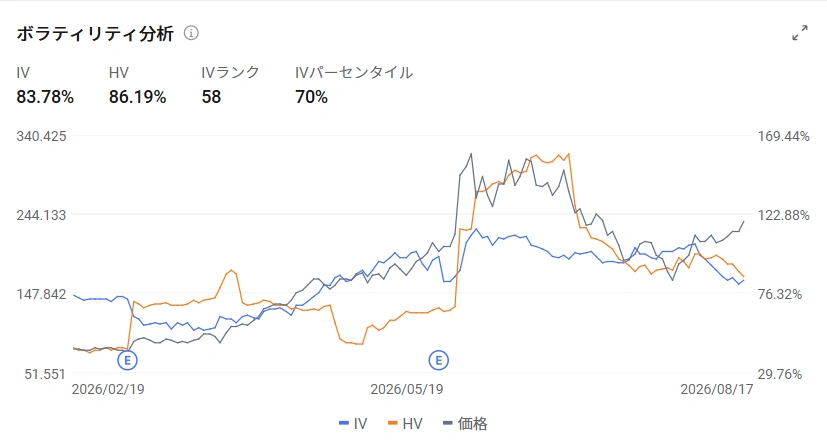
IV rose from approximately 81.5% the previous day to 83.8%, an increase of about 2.3 percentage points day-over-day. There has been no sharp drop in IV; instead, it has been gradually rising as the earnings date approaches.
The IV Rank is approximately 58, and the IV Percentile is around 70%, indicating a slightly elevated level within the historical range. Meanwhile, the 30-day Historical Volatility (HV) stands at about 86.2%, meaning current Implied Volatility (IV) and realized volatility are nearly at the same level. IV is not significantly overpriced relative to realized values.
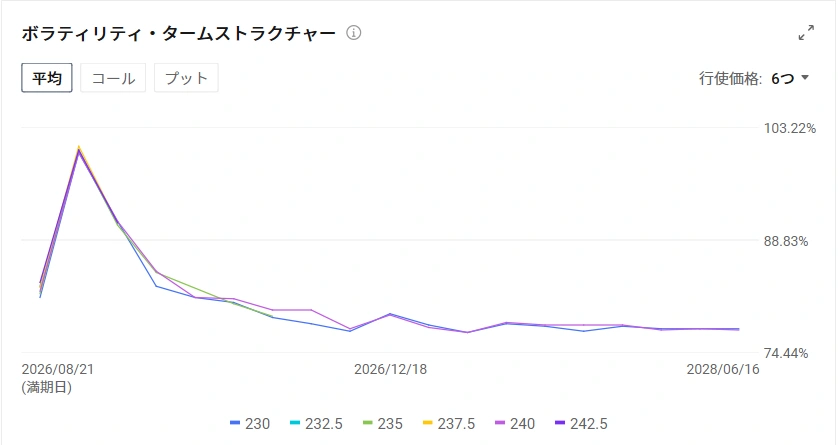
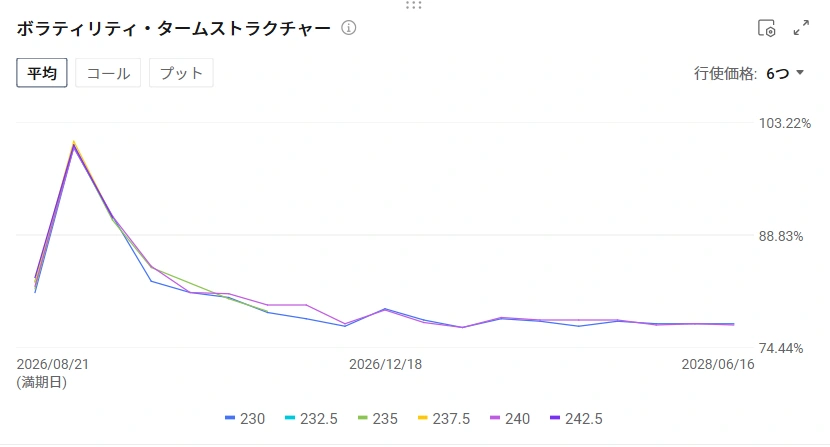
Looking at IV by expiration date, the pricing in of earnings events is more distinct. ATM IVs are as follows: August 21 expiry at ~82.4%, August 28 expiry at 100.4%, September 18 expiry at 81.4%, and October 16 expiry at 78.1%.
The last expiration date before the August 27 earnings announcement is August 21, while the first expiration crossing the earnings event is August 28. The IV difference between these two dates reaches approximately 18.0 points.
A clear event premium is added to the August 28 expiry, which spans the earnings release. For the September and October expiries, IV drops back to around 80%, indicating that the rise in volatility is concentrated on the specific earnings event rather than broadly pricing in medium- to long-term risks.
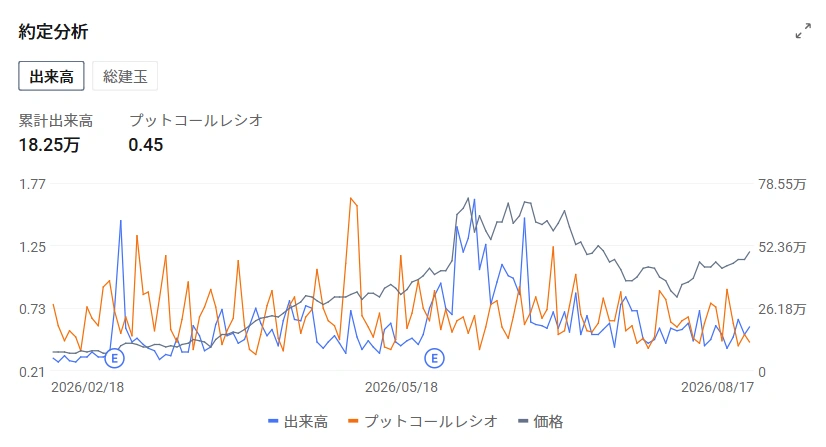
In terms of trading volume, the aggregate Put/Call Ratio across all expiries was approximately 0.45, showing that call trading was significantly dominant on the day.
However, the picture differs when looking at existing positions. As of August 17, confirmed open interest showed an aggregate Put/Call Ratio of about 1.07 across all expiries, with a slight bias toward puts.
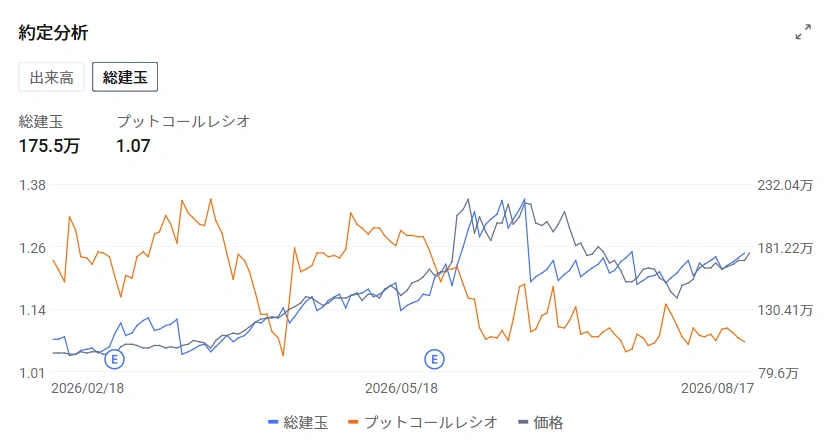
In other words, there is a divergence where daily trading flow favored calls, while existing open interest leaned slightly toward puts. However, since open interest alone cannot determine the direction of buyers versus sellers, we cannot conclude that bearish positions are dominant based solely on this metric.
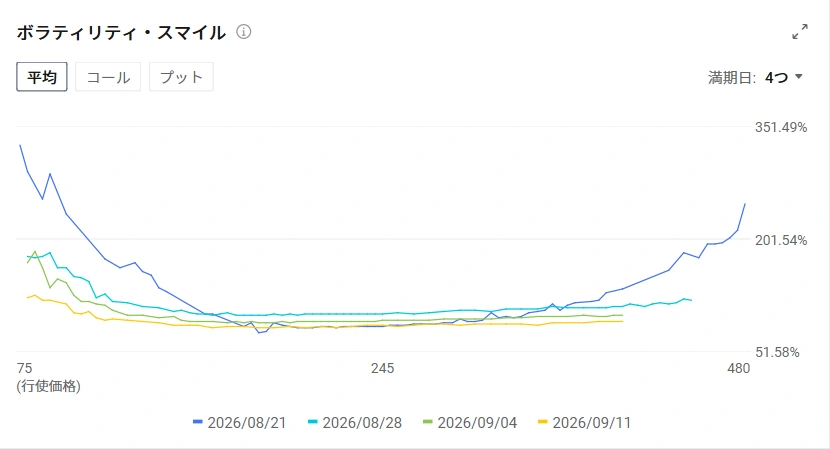
The 25-delta Risk Reversal for the August 21 expiry was approximately +2.83 points. This indicates a call skew where call-side IV slightly exceeds put-side IV, implying a small premium on upside options.
Nevertheless, the shape of the volatility smile only reflects relative biases in option pricing and does not independently indicate market direction.
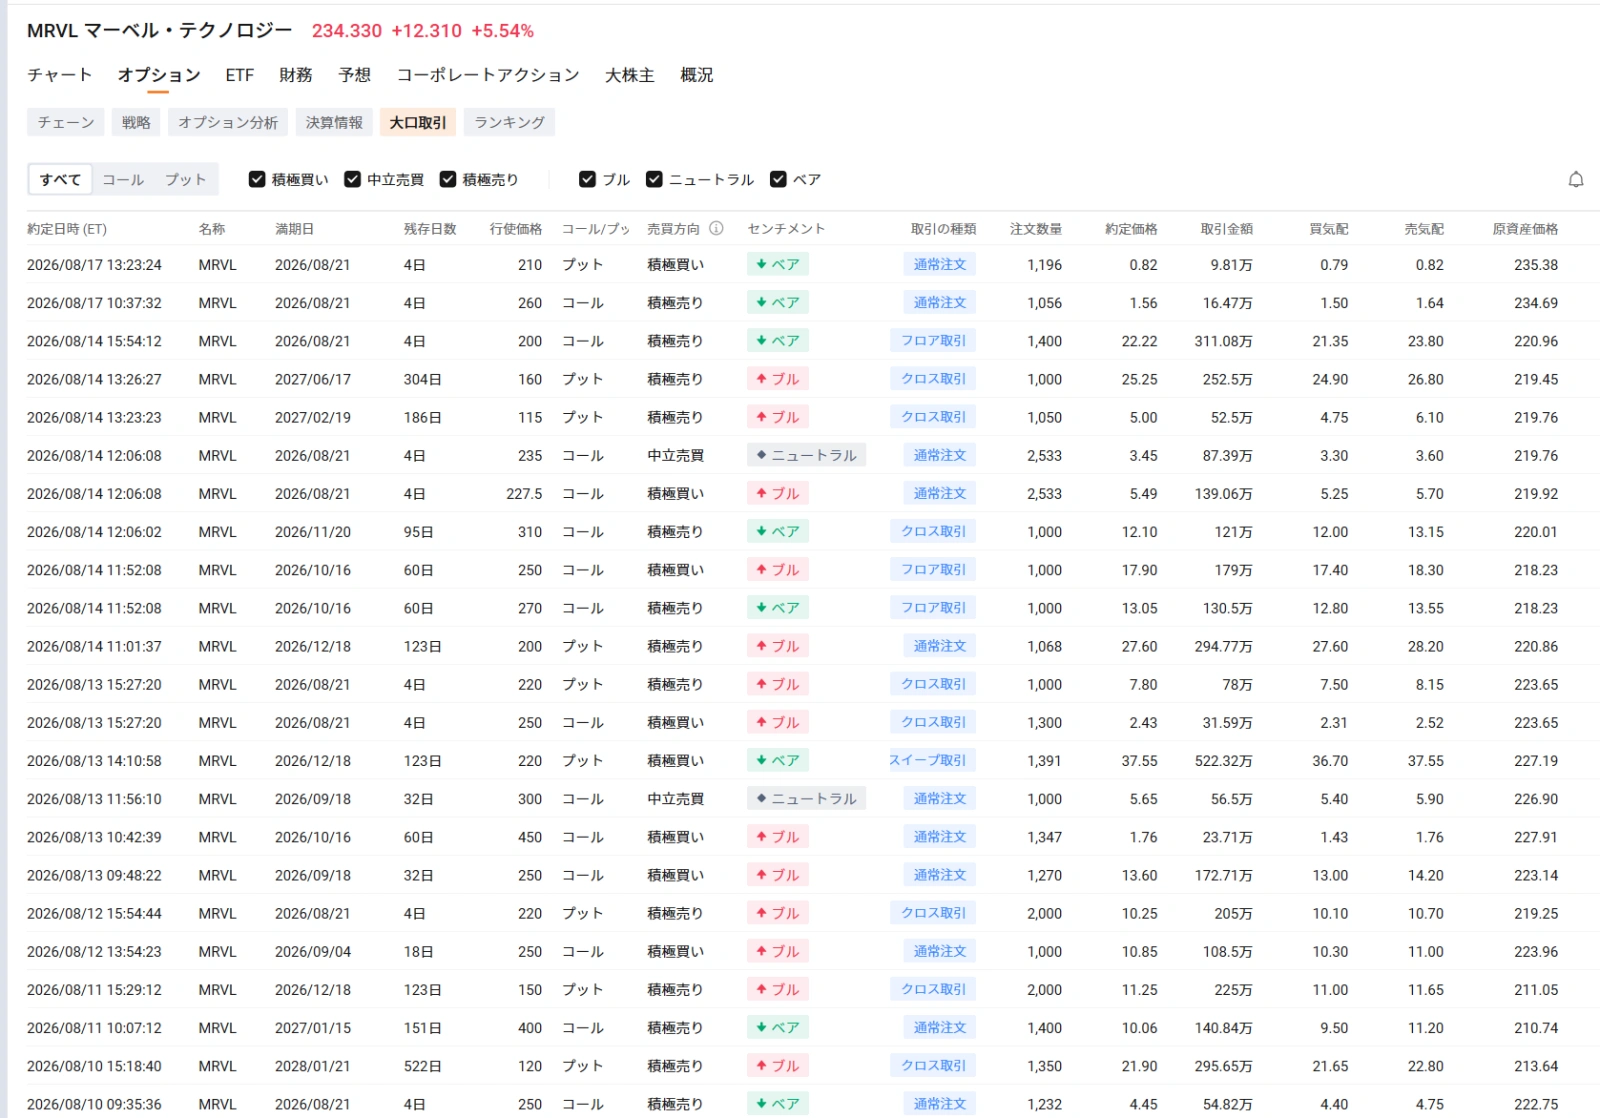
Block trades show mixed bullish and bearish signals. Recently, transactions suggesting bearish sentiment, such as buying near-term puts and selling calls, have been observed. Prior to that, there were also signs of bullish activity, including call buying, multi-leg cross trades, and floor trades.
Since complex strategies and single-leg trades were not separated for aggregation this time, the accuracy of directional judgment remains low to moderate. It is difficult to interpret the overall large-block flow as a clear bullish or bearish signal.
*The MRVL options market is pricing in the August 27 earnings event most clearly, rather than the stock’s direction. While an event premium of approximately $18 is added to the August 28 expiration (straddling the earnings release), trading volume on the day favored calls, whereas existing open interest remains nearly neutral. Going forward, the focus will be on whether the event premium for the August 28 expiration expands further, or if the 25-delta risk reversal shifts further toward the call side.
$SanDisk (SNDK.US)$ rose approximately 8.9% on the 17th. In addition to expectations for storage demand for AI data centers, reports that the Trump administration urged Apple to avoid sourcing memory chips from Chinese memory companies served as a new catalyst for buying.
Some analysts pointed out that this move could ease competitive pressure from Chinese firms for US memory-related companies such as SNDK, Micron, and Western Digital. Coupled with expectations for mid-to-long-term growth highlighted in recent investor presentations, SNDK is being viewed not only as part of the broader semiconductor market rebound but also as having its own specific buying catalysts.
However, in the options market, implied volatility (IV) has not risen as sharply as the surge in the underlying stock price.
Although IV rose by approximately 3.5 points from the previous day to around 88.5%, the IV Rank remained at approximately 32, and the IV Percentile at around 15%, still indicating a low position within the historical range. Meanwhile, the 30-day historical volatility (HV) is extremely high at approximately 152.1%.
In other words, even as the stock price surges on new policy developments, IV remains significantly below realized volatility. The options market has yet to provide a clear answer as to whether the current intense price movements will continue or if the recent spike is temporary.
However, this divergence cannot be immediately interpreted as ‘options being cheap.’ There is a possibility that IV will rise and narrow the gap, or conversely, that stock price volatility will stabilize and the divergence will resolve through a decline in HV.
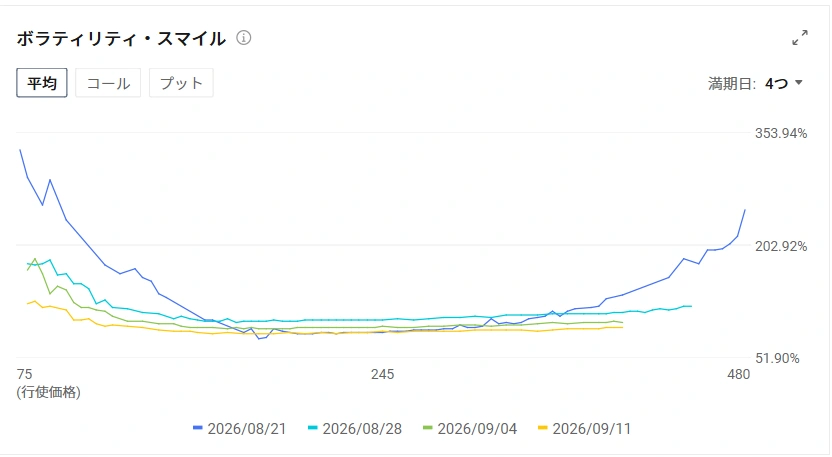
Looking at the term structure, ATM IV is approximately 100.3% for the August 21 expiration, 86.7% for the September 18 expiration, and 87.7% for the October 16 expiration, resulting in a difference of approximately 13.6 points between the near-term and medium-term expirations.
Despite the absence of clear scheduled events, near-term implied volatility (IV) remains high,and the market is in backwardation.This is a notable point. In addition to recent significant stock price fluctuations, headline risks surrounding AI demand and US-China semiconductor policies may be heavily priced into the near-term zone.
The aggregate put-call ratio by volume across all expiration months was approximately 0.87, indicating that call options slightly dominated trading on the day.
Given the roughly 9% rise in the stock price, the market cannot be described as extremely one-sided toward calls. While there is momentum chasing higher prices driven by policy factors and expectations for AI storage demand, the overall options market has not tilted significantly in one direction.
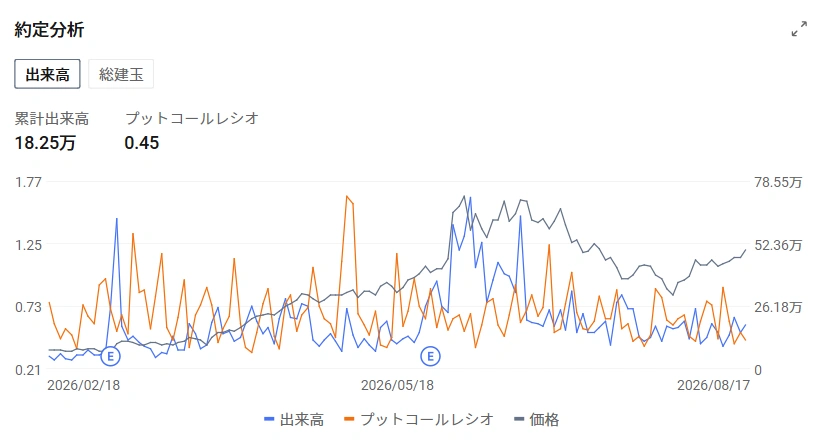
On the other hand, based on confirmed open interest as of August 17, the put-call ratio was approximately 1.17, showing a higher concentration of puts.
In other words, while recent trading flow leans toward calls, a divergence remains with existing open interest still leaning toward puts. However, since open interest alone cannot determine the direction of buyers and sellers, this cannot be directly interpreted as bearish positioning.
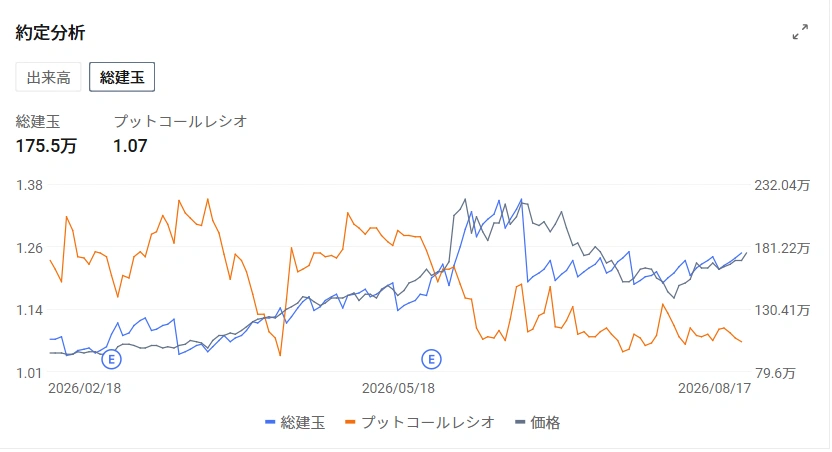
The 25-delta risk reversal for the August 21 expiration settled at approximately +3.22 points. This reflects a call skew where IV for calls exceeds that for puts, indicating a slightly higher premium for upside options.
While this movement aligns with interest in upside potential driven by policy factors and AI storage demand, the skew alone is insufficient to conclude that strong conviction in a bullish direction has formed.
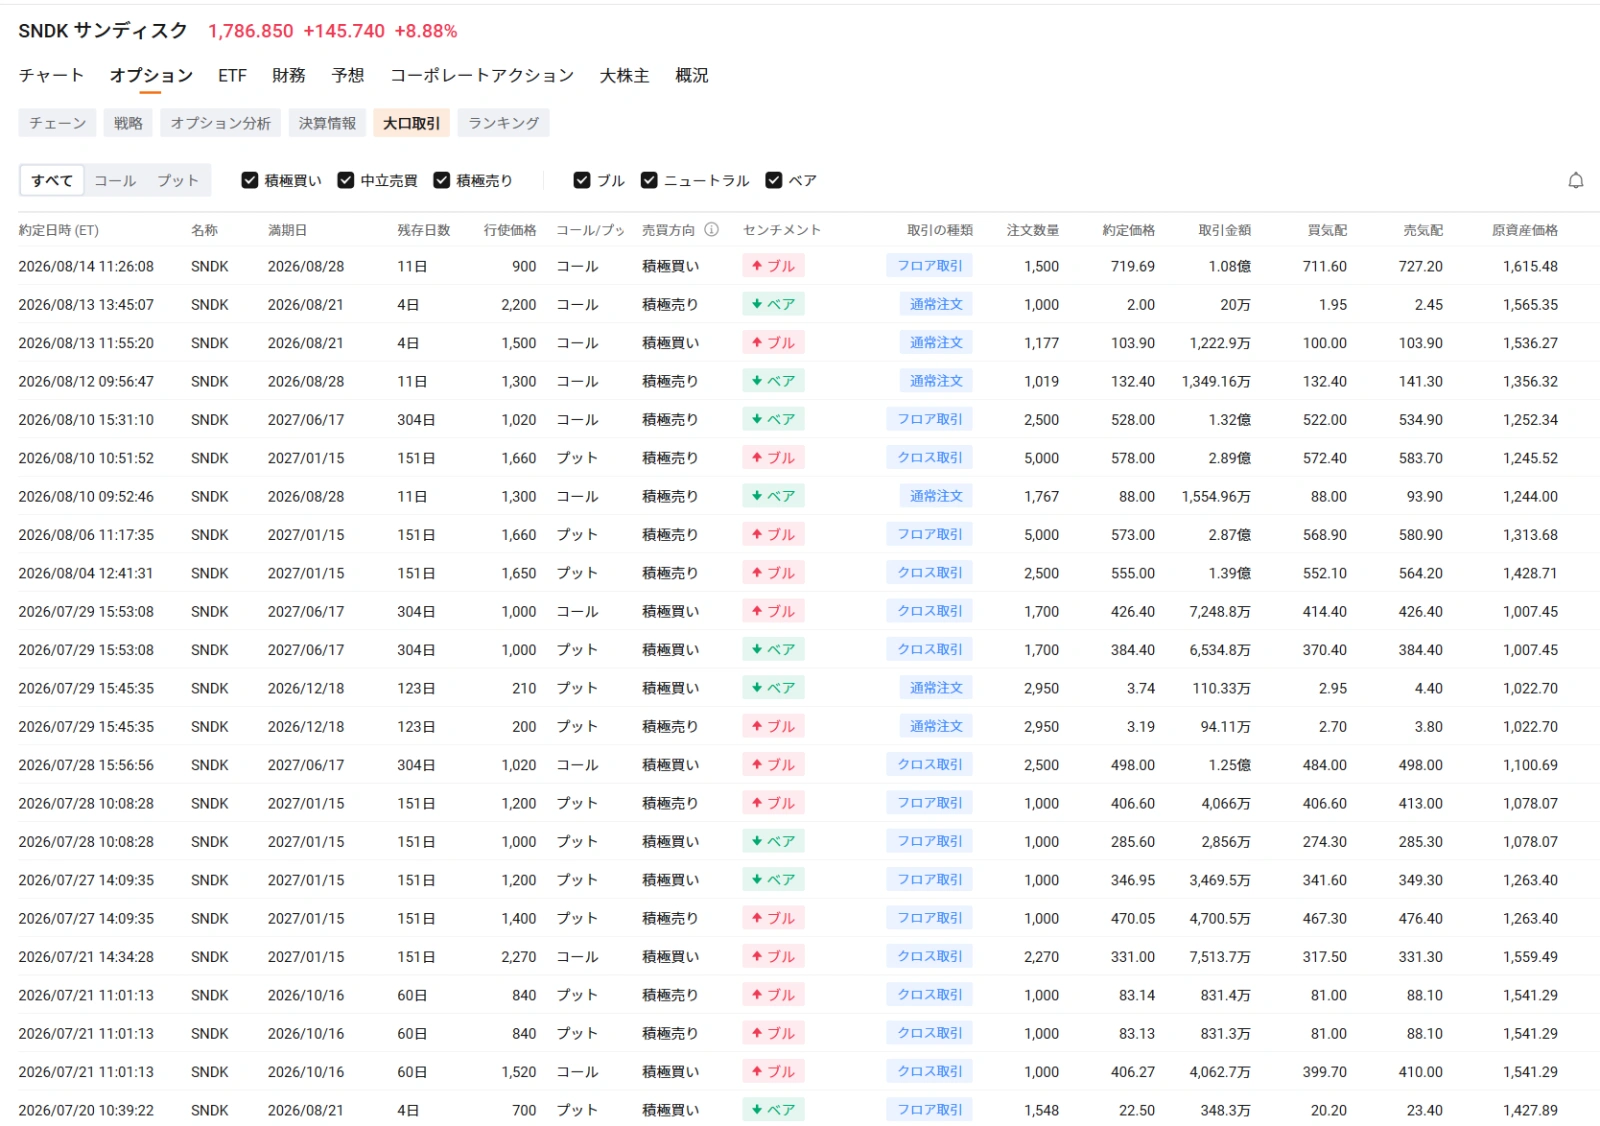
In block trades, cross-trades involving multiple legs and floor trades were prominent, with significant put selling and call buying also observed.
Therefore, it is premature to interpret the superficially high call volume simply as “bullish follow-through buying driven by policy developments.” In reality, many trades are structured positions combining multiple options, likely involving a mix of position adjustments and volatility trading.
*For SNDK, in addition to AI storage demand, reports that the US government urged Apple to avoid sourcing memory chips from China provided further tailwinds. Meanwhile, despite the sharp stock price rally, IV remains at the lower end of its historical range, significantly below the 30-day HV. While near-term backwardation and call skew indicate interest on the upside, large-block trades often involve structured products. Going forward, the focus will be on whether policy developments translate into actual demand and market share expansion, as well as which side—IV or HV—will close the significant divergence between them.
$Direxion Daily Semiconductor Bull 3x Shares ETF (SOXL.US)$ is showing different dynamics. As a leveraged ETF aiming for triple the daily investment return of semiconductor stocks, it lacks idiosyncratic events typical of individual companies. In the options market, with earnings reports from various semiconductor firms coming in succession, there is a strong display of hedging demand against downside risks associated with leverage.
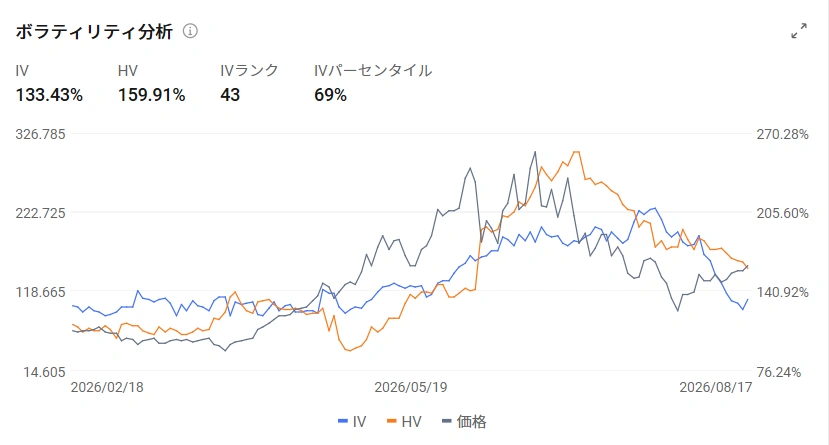
IV rose by approximately 7.3 points from the previous day to around 133.4%. The IV Rank is approximately 43, and the IV Percentile is around 69%, indicating elevated levels not only in absolute terms but also relative to its historical range.
On the other hand, the 30-day HV is even higher at approximately 159.9%. Although IV itself is at a high level, actual price movements are exhibiting even greater volatility.
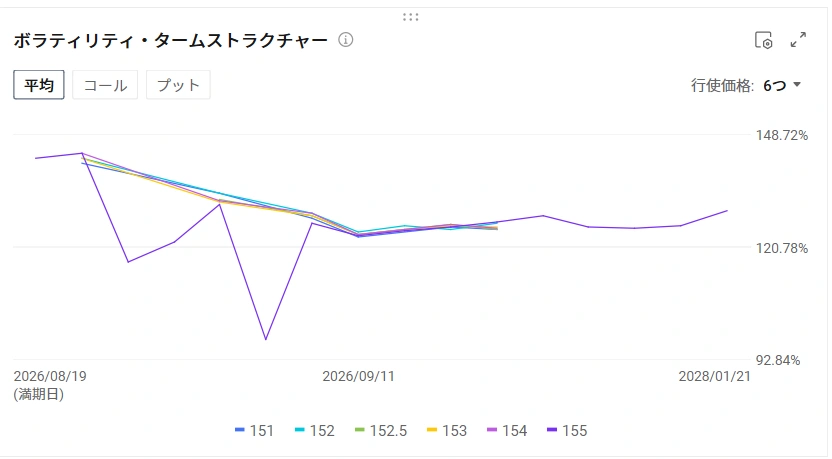
The term structure is also in backwardation. ATM IV is approximately 140.2% for the August 21 expiration, 125.6% for September 18, and 128.4% for November 20, resulting in a difference of about 14.6 points between the near-term and medium-term expirations.
Volatility is concentrated in the short-term window surrounding the successive earnings releases of semiconductor companies, pushing up premiums for near-term options.
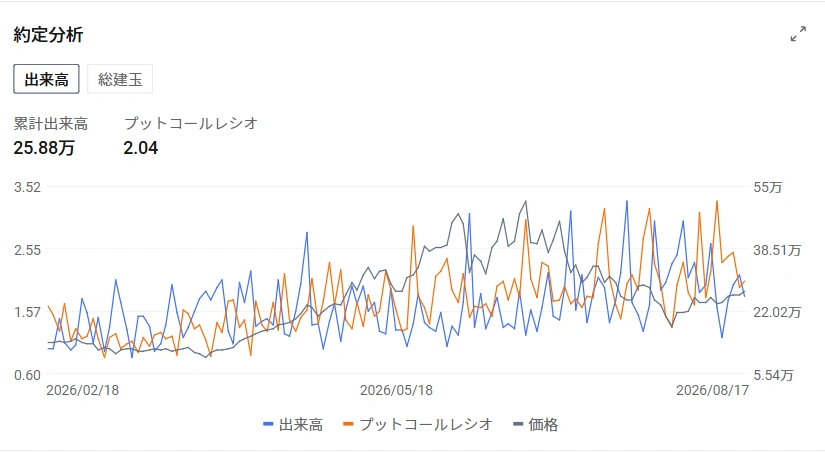
Volume clearly favors puts. The aggregate put-call ratio across all expirations based on volume is approximately 2.04, with put volume more than double that of calls.
Existing open interest shows the same trend. As of August 17, confirmed open interest showed a put-call ratio of approximately 2.19, indicating a significant excess of puts.
Unlike SNDK and MRVL, SOXL shows put dominance in both daily trading flow and existing open interest, with no clear divergence between the two.

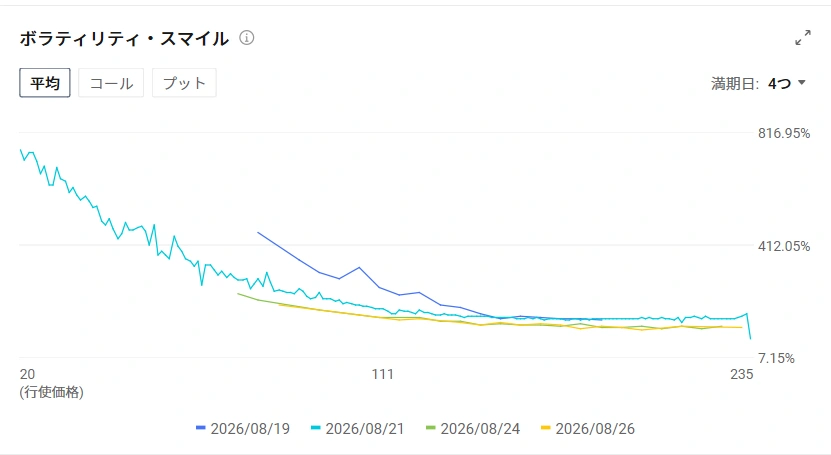
The 25-delta risk reversal for the August 21 expiry settled at approximately -6.24 points. The pronounced put skew, with put-side IV significantly exceeding call-side IV, strongly reflects hedging demand against downside risk in option pricing.
A similar trend is evident in block trades. Recently, there has been a noticeable increase in buying of near-term puts, with relatively frequent single-leg put transactions targeting downside moves.
While the accuracy of directional forecasts remains low to moderate, the current flow is more easily interpreted as downside hedging against highly leveraged semiconductor exposure rather than chasing upside momentum.
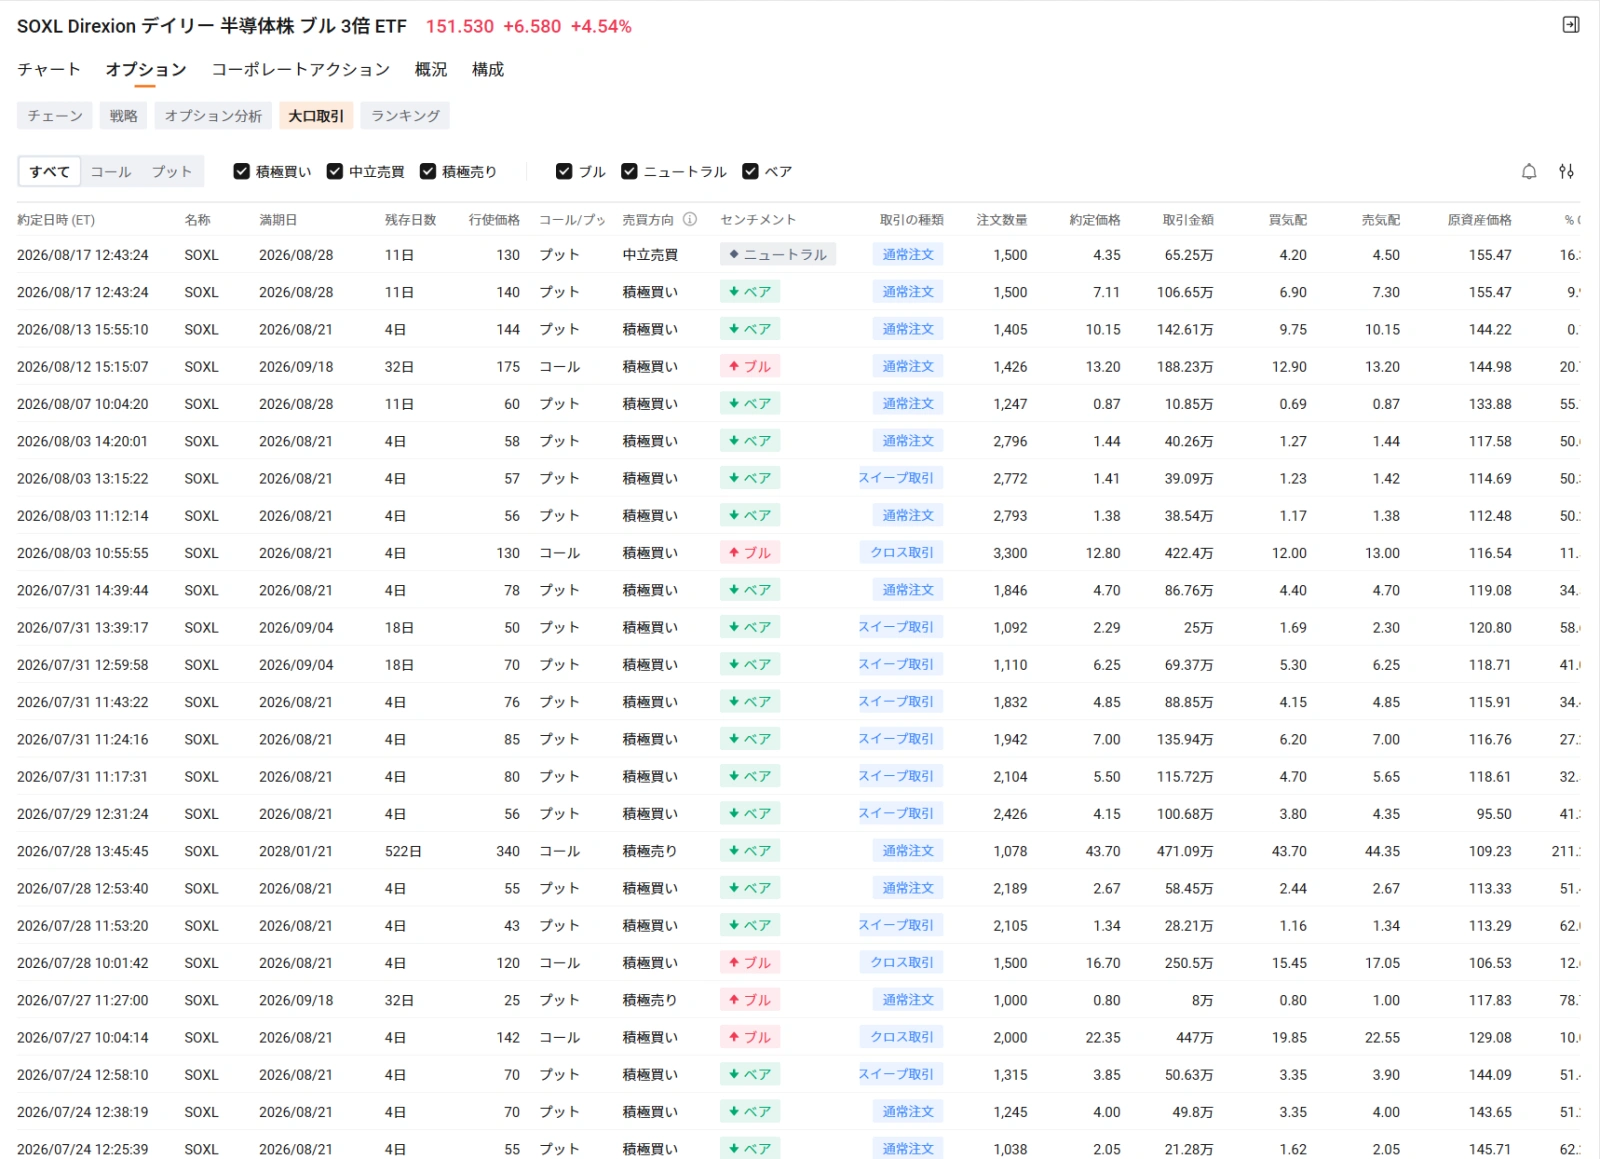
※In SOXL’s options market, demand for downside hedging on leveraged semiconductor exposure is distinct. This is evidenced by put-dominant volume and open interest, a significantly negative risk reversal, and backwardation in near-term IV. Going forward, the focus will be on whether the put skew widens further or if the put-heavy open interest unwinds after semiconductor companies report earnings.
According to moomoo’s probability analysis (68.27%, ±1σ), the projected price range until the common September 18 expiry is: $Direxion Daily Semiconductor Bull 3x Shares ETF (SOXL.US)$ approximately ±37.5%,
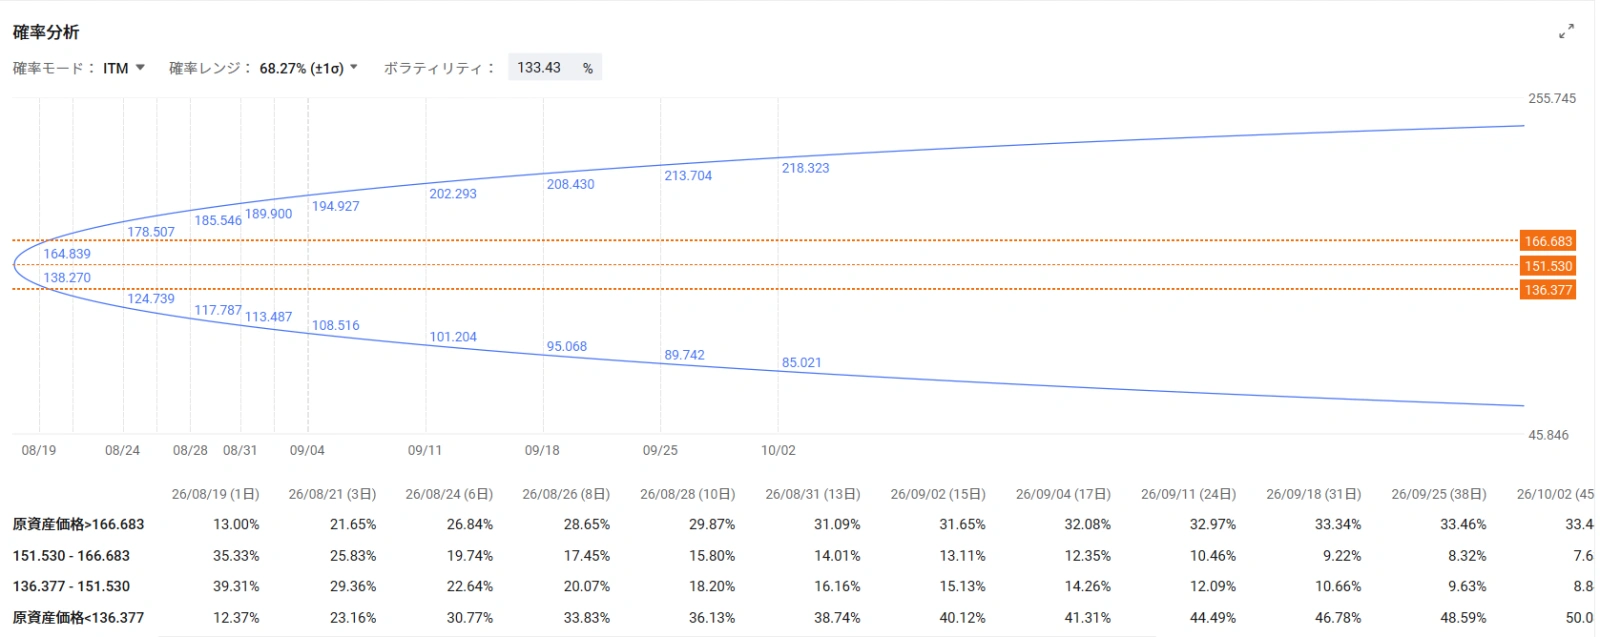
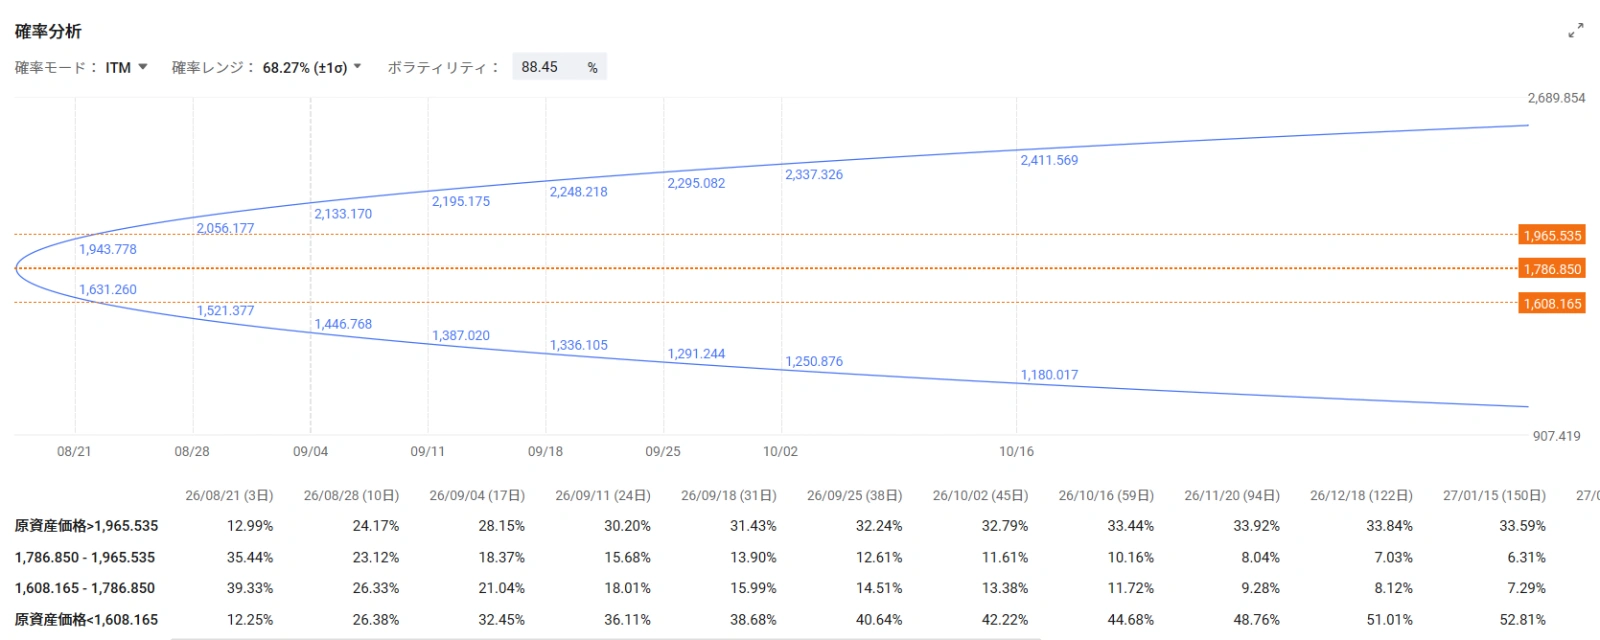
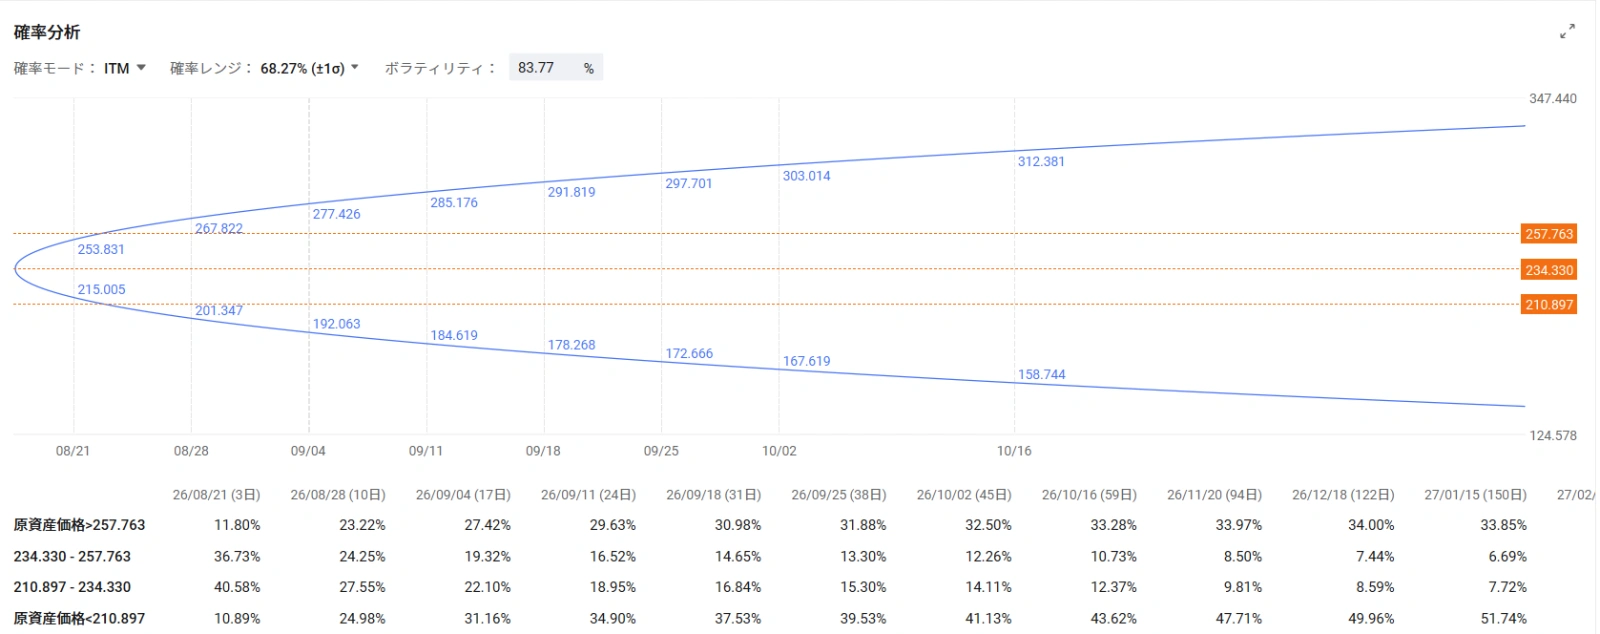
SOXL’s exceptionally wide projected range reflects its 3x leverage and high levels of implied volatility.
Note that Marvel’s August 21 expiration does not span the August 27 earnings release. The pricing in of the earnings event is reflected in the term structure as an event premium of approximately 18.0 points added to the August 28 expiration.
Although all three stocks rose on the same AI capex theme, there are clear differences in the risks priced into the options market.
In other words, even within the same AI capex trade, option prices strongly reflect distinct factors: the upcoming earnings event for Marvel, persistently high realized volatility following SanDisk’s surge, and downside hedges against the broader semiconductor sector for SOXL.
Going forward, key points to watch include whether Marvel’s event premium for the August 28 expiration expands further ahead of earnings, whether SanDisk’s IV-HV divergence narrows via rising IV or falling HV, and whether SOXL’s put skew and put-dominant open interest strengthen further.
-moomoo News Kingsley
This document is prepared solely for informational purposes and does not constitute a recommendation to invest in or trade any specific financial instrument. Investors are solely responsible for their own final investment decisions and the resulting outcomes. Financial instruments carry risks including price volatility, credit risk, and liquidity risk. Principal is not guaranteed and losses may occur. The company assumes no liability whatsoever for any damages arising from the use of this document or from investment decisions made based on its content. Option trading involves the risk of losses exceeding the initial investment. Please be sure to review all key documentation—including the Contract Pre-Conclusion Document, Subscription Agreement, and other materials—covering important matters such as risks and fees, and trade only at your own discretion.