

บทความนี้มีประมาณ 4156 คำ การอ่านทั้งหมดใช้เวลาประมาณ 6 นาที
Original Author: Darko, IOSG
ETF inflows are often seen as a “thermometer” of institutional conviction in Bitcoin. But week-to-week, they measure something else: a hidden interest-rate trade being turned on and off. This article clarifies how to distinguish it, how big this trade really is, and why it is quietly exiting.
TL;DR
- Week-to-week, ETF flows are primarily driven by a hidden arbitrage trade, not conviction. Cash-and-carry traders buy the ETF while shorting futures on the CME, hedging price risk, but are indistinguishable from true believers in the data. Roughly half of the weekly flow volatility can be explained solely by new short positions from hedge funds, with a correlation of 0.70.
- Weekly Bitcoin price changes barely explain the flows. Regressing ETF flows on weekly Bitcoin returns yields a result statistically indistinguishable from zero. Weekly capital is not chasing price performance; it moves in lockstep with a hedged interest-rate trade.
- Arbitrage dominates weekly “volatility” but has never been the bulk of “stock”. Of the ~$55 billion cumulative ETF inflows, the current net arbitrage position is only about $1 billion; the rest is steady, directional buying power of roughly $400 million weekly, compounded over two years to form nearly the entire mountain.
- A more accurate statement: ETF flows overstate the “volatility” of conviction, not its “level”. Weekly ups and downs are largely “borrowed”—arbitrage capital comes and goes; while the assets that truly accumulate are mostly “owned.”
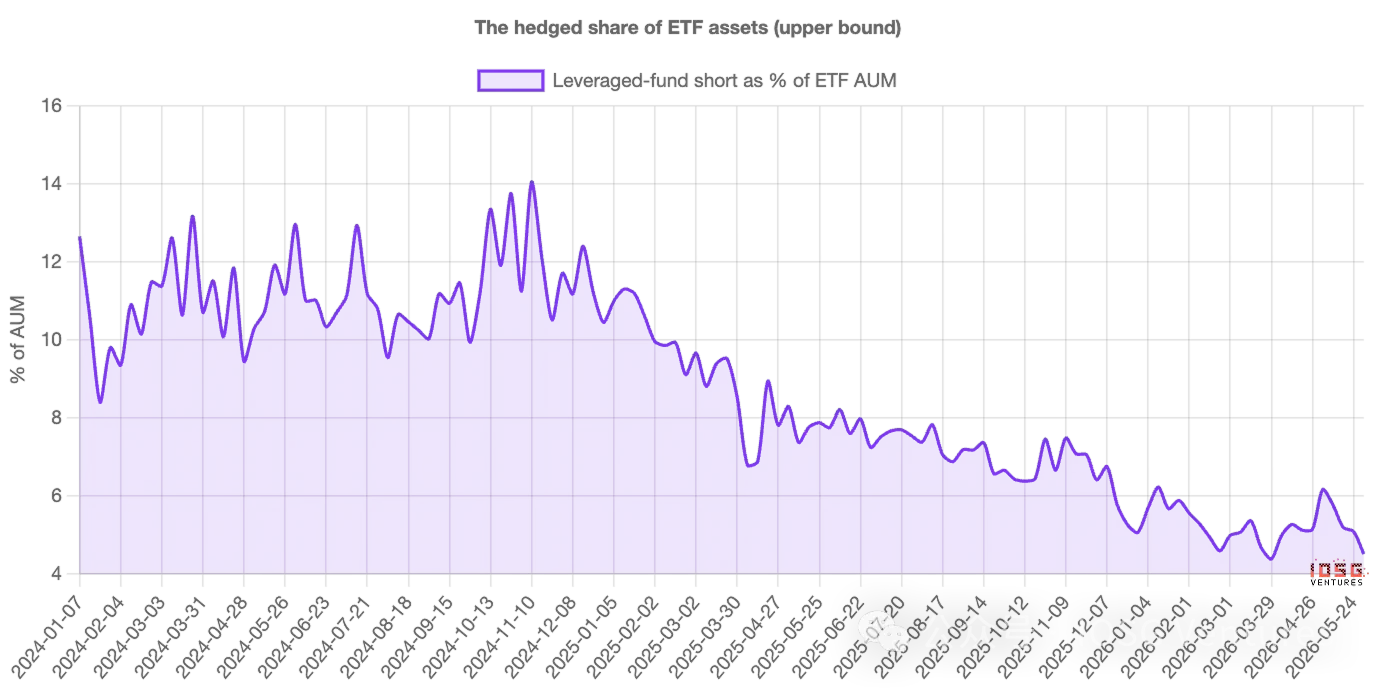
- This trade is exiting, and has been for two years. Leveraged fund short positions, from about $3 billion at launch to a peak of ~$14 billion in late 2024, have steadily declined to about $4.5 billion. Once the basis compresses to unprofitability, inflows and shorts will fade in sync—don’t mistake the resulting outflows for a market verdict on Bitcoin.
1. The Number Everyone Watches
Every week, Bitcoin ETFs report inflows or outflows, and this number is often treated as a verdict. Large inflows mean institutions are piling in; outflows imply shaken confidence. Flow data has quietly become the headline gauge for market conviction.
The problem is that not everyone buying the ETF is betting on Bitcoin. Some of the biggest buyers couldn’t care less about the price direction—once you account for them, weekly flow numbers measure their activity more than anyone’s beliefs. To understand why, you need to meet a different kind of buyer.
A Buyer Who Doesn’t Care About Price
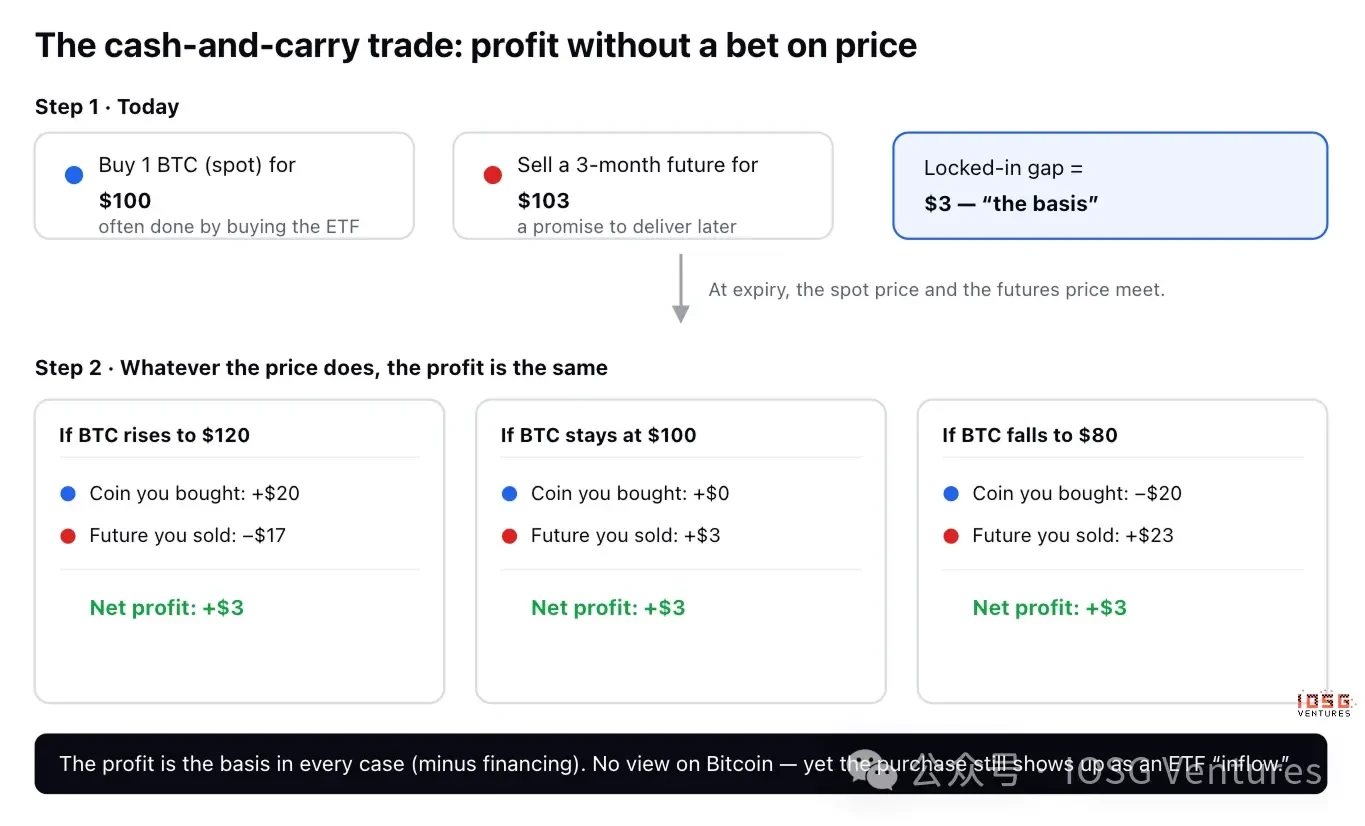
There is a classic, boring trade called cash-and-carry arbitrage. A Bitcoin “future” is just a contract to buy or sell Bitcoin at an agreed price on a future date, and most of the time, the futures price is slightly higher than the current spot price—say Bitcoin is $100 now, but a three-month contract sells for $103.
A trader can capture this $3 spread without any view on price:
- Buy 1 Bitcoin today for $100 (often achieved by buying the ETF).
- Sell the future at $103, promising delivery in three months.
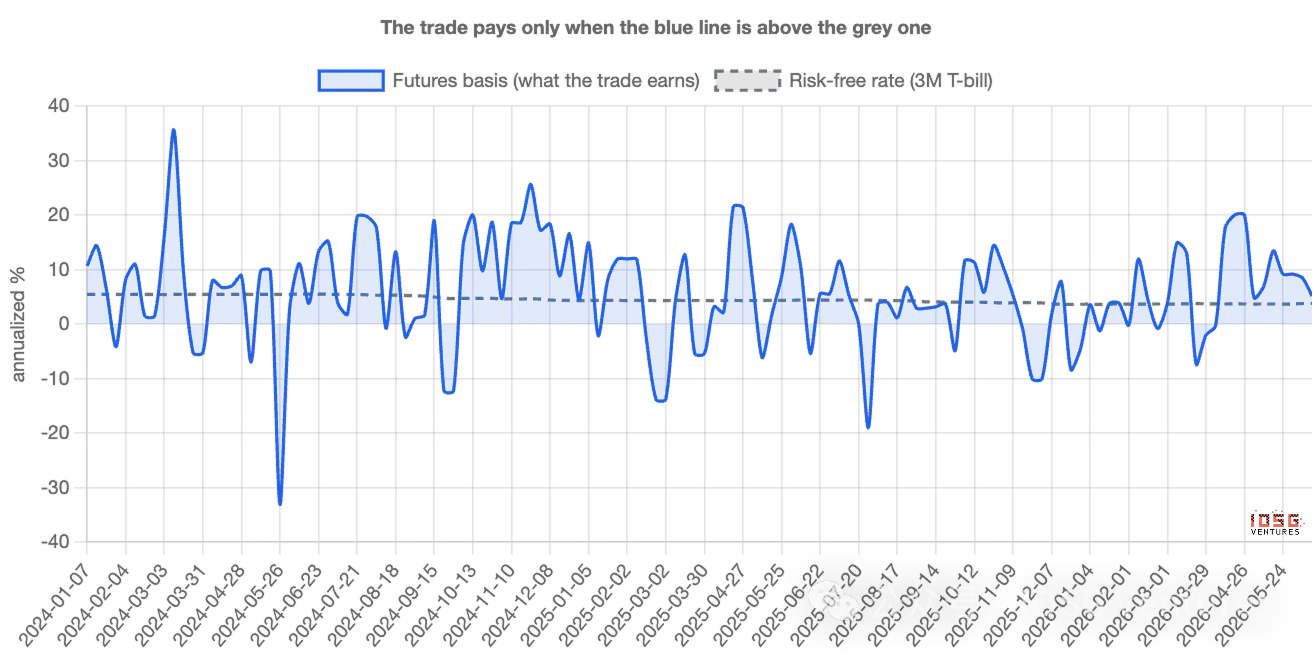
See what happens at expiry. If Bitcoin soars to $120, the trader makes $20 on the coin but loses $17 on the contract—net $3. If it crashes to $80, the coin loses $20, the contract gains $23—still net $3. If it stays flat, still $3. Profit is the same either way. The direction is hedged away; traders call this “delta neutral.” This $3 spread, expressed annualized, is the basis—essentially an interest rate the trader earns for parking capital in this trade; as long as it exceeds the risk-free return from T-bills, the trade is worth doing.
Why This Pollutes the Headline Number
Here’s the key. The first leg—buying 1 Bitcoin—is very commonly done by buying the ETF. Consequently, a delta-neutral trader with zero opinion on Bitcoin registers as an ETF inflow in the data, looking identical to a true believer on the surface.
When a large amount of cash-and-carry is set up, inflows appear strong, and the narrative “institutions are adding” fits naturally—even though this capital is hedged and will reverse as soon as the trade becomes unprofitable. In other words, the flow number measures not just conviction; it measures the activity of the arbitrage desk. The question is how to separate them—and how big each part really is.
How to Tell Them Apart
Cash-and-carry traders leave a second footprint. For every dollar of Bitcoin they buy, they short a dollar of futures on the CME (the regulated US exchange where institutions trade Bitcoin futures). True believers leave only the first footprint; arbitrageurs leave both.
And the second footprint is public. The US derivatives regulator publishes weekly reports disclosing the size of long and short positions held by various trader types on the CME. One category—leveraged funds, essentially hedge funds—is where the cash-and-carry crowd lives. So you can line up, week by week, ETF inflows against the new short positions these funds establish. If “demand” were conviction, there should be little connection; if a large part is that hidden trade, they should move in tandem.
2. What the Data Says: Week-to-Week, Flows Follow Futures, Not Price
They move tightly together. For every week since the ETF launched, the more new shorting funds did, the more ETF inflows occurred—almost one-for-one. About half of the entire weekly flow volatility can be explained by this single thing: how much shorting funds did. The correlation is 0.70, the kind you see between two things that are clearly related, not coincidental.
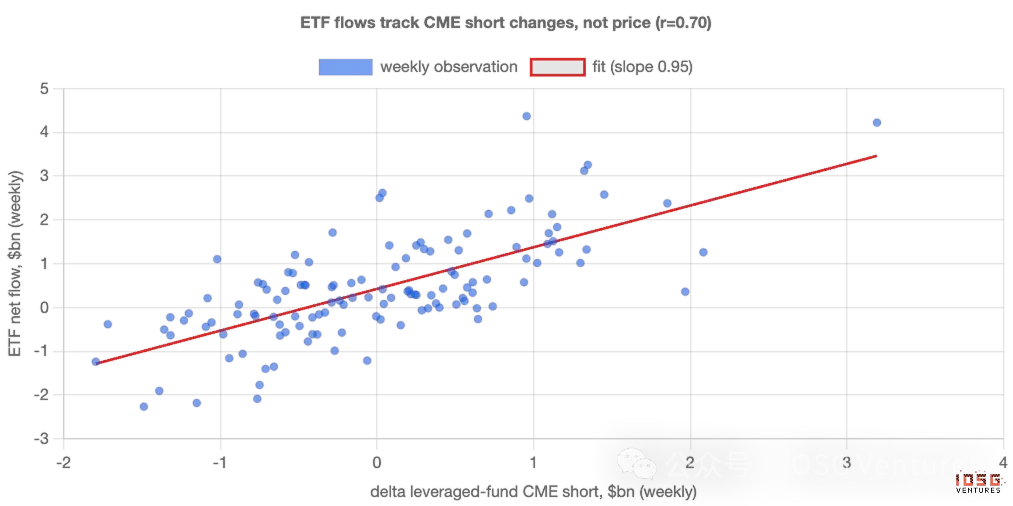
The detail most striking to believers: price itself explains almost nothing. Testing whether weekly Bitcoin returns predict ETF flows yields an answer statistically indistinguishable from zero. Weekly capital is not chasing performance; it marches in lockstep with a hedged interest-rate trade.
So, as a week-to-week signal, ETF “demand” is primarily arbitrage. The flow number is a poor thermometer for conviction because its ups and downs result from the basis trade being turned on and off, not from anyone changing their mind about Bitcoin.
But How Much of the Capital is Actually This Trade?
Here, the simplistic narrative—”it’s all fake”—falls apart, and the real story gets more interesting. The basis trade dominates weekly volatility but has never been the bulk of capital.
Decompose weekly inflows into the part explained by futures shorting (hedged) and the rest (directional), then cumulate from launch. Of the ~$55 billion cumulative ETF inflows, the basis trade currently accounts for a net of only about $1 billion—the rest is steady, directional buying power. This directional flow is roughly $400 million per week, week after week, regardless of basis or price, compounded over two years to form nearly the entire mountain.
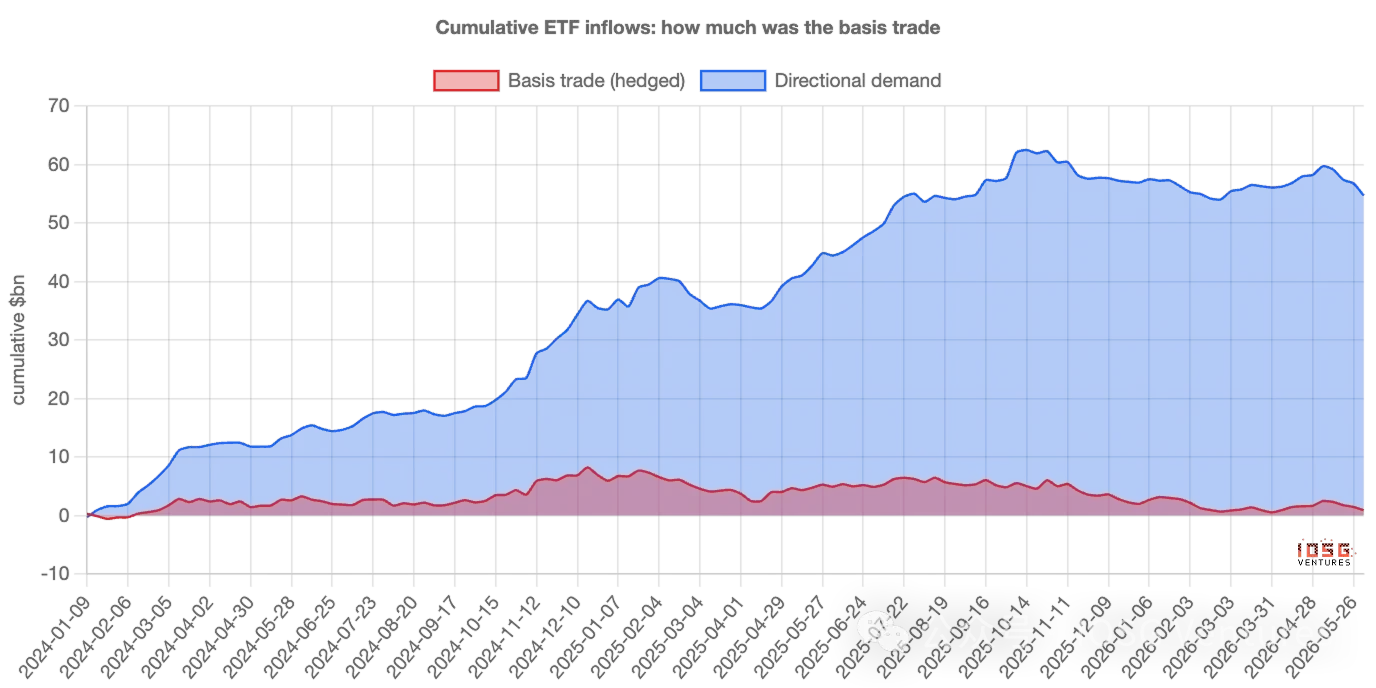
Viewed as a share of ETF assets rather than flows, the picture is the same: the hedged portion peaked near 14% of ETF assets in 2024, now sitting around 4%–5%. At its height, it was a notable minority; today, it’s a sliver.
So, a more precise statement: ETF flows overstate the volatility of conviction, not its level. Weekly ups and downs are largely “borrowed”—arbitrage capital comes and goes; but the assets that truly accumulate are mostly “owned.” This trade churns through the flow data but has never been the bulk of the balance.
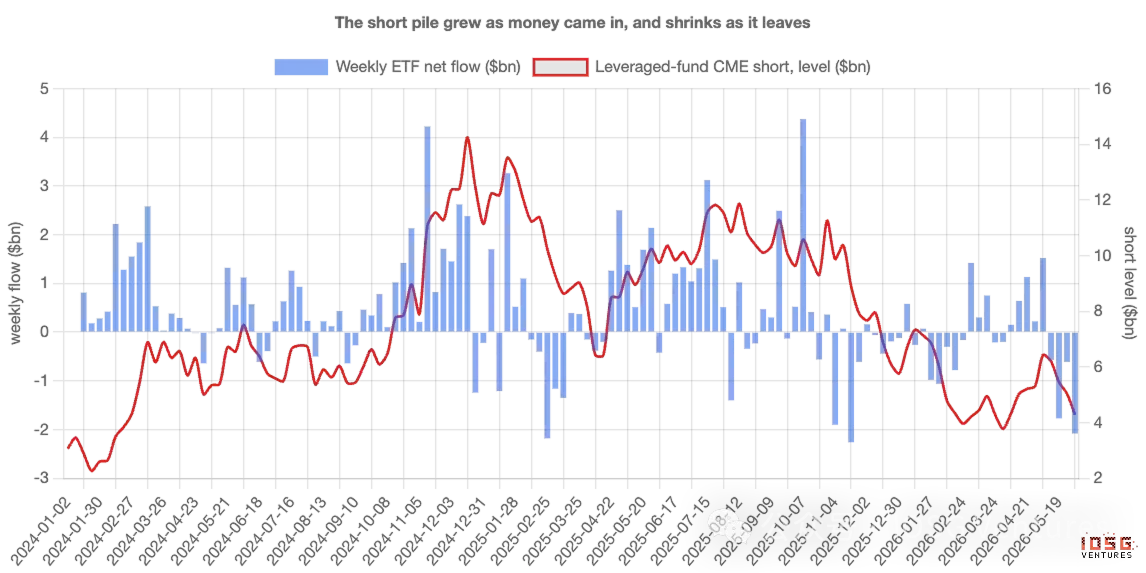
And This Trade is Exiting
The hedged part hasn’t just been small—it has been shrinking for two years. Leveraged fund short positions, from about $3 billion at launch, stacked to ~$14 billion by end-2024, then steadily declined to about $4.5 billion. This arbitrage trade has been unwinding throughout the entire period, not just recently.
This matters for interpreting the present. Entering June, hedged positions roughly halved again—fund shorts went from ~$6.4 billion to $4.3 billion—as ETFs saw daily outflows of $300 to $500 million. Looking only at the surface number, it seems like panic capitulation. But with futures data, it’s just routine clearing of a trade that’s no longer profitable. The same outflow number, two completely different stories.
When Basis Compresses, Demand Fades
The cleanest evidence is what happens when this trade becomes unprofitable. When that $3 spread narrows close to what traders can earn risk-free, the trade isn’t worth doing. If a large chunk of weekly demand really is this trade, then weekly demand should weaken exactly when the spread compresses—and it does. Strip the trend from each series and look at moments around a compression: ETF inflows drop below their normal rhythm, funds cover their shorts simultaneously. Demand breathes with the trade.
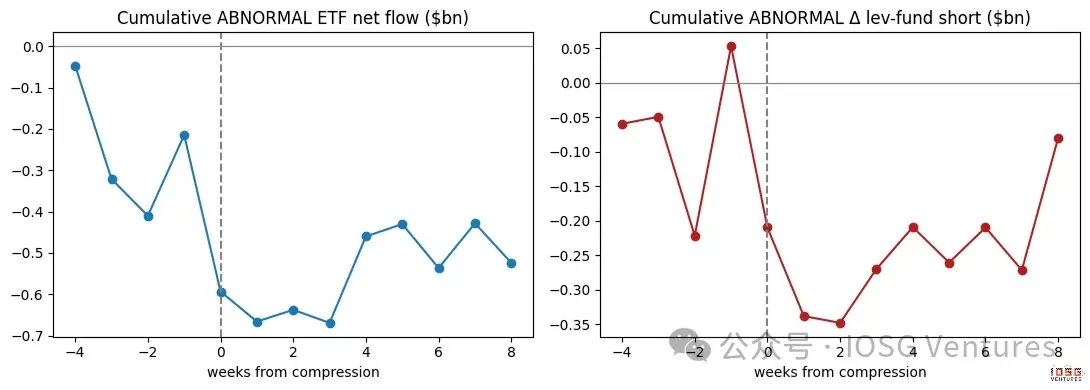
True believers don’t care about futures basis. This weekly “demand” clearly does.
3. Which Comes First, and Who’s Really Operating
First, this relationship is contemporaneous—tightest within the same week, with no clear lead or lag; the little directional evidence there is actually points the opposite way: ETF flows drive the shorts, not vice versa. This fits the logic of a paired trade—buy the ETF first, futures hedge follows—rather than shorting magically conjuring inflows. Second, the arbitrage crowd isn’t the only driver. Flows track most tightly with leveraged fund shorts, but also resonate with directional institutional positioning—both types are active. This article’s claim is not that every inflow is hedged; it’s that hedged trading is the tightest, most reliable driver of week-to-week volatility.
Ethereum: Same Trade, But the Math Barely Works Out
Applying the same test to Ethereum ETFs, the pattern is present but weaker—looser association with futures shorting, and the underlying steady directional bid is nearly absent. The reason is clear. Holding spot Ethereum rather than futures means forgoing the staking yield that Ethereum offers, around 3%–4% per annum. After accounting for this, Ethereum’s basis is often negative—the arbitrage trade often doesn’t even clear its hurdle rate. So Ethereum ETFs have neither strong conviction buying nor robust arbitrage positioning to prop them up; they are simply smaller and noisier than their Bitcoin counterparts.
4. How to Interpret ETF Flows From Now On
The takeaway is not a price call, but a framework for reading flows. When basis is fat, expect “institutional demand” to appear strong and largely hedged—don’t mistake that strength for conviction. When basis compresses, expect inflows and shorts to fade together—don’t mistake the resulting outflows for a market verdict on Bitcoin. The two numbers worth watching are: the annualized basis relative to T-bill rates, and the net short position of leveraged funds in the weekly CME report. They’ll tell you how much of the next “demand” headline is real.
How We Measured It
A few honest limitations. The basis is constructed from the nearest-month CME futures contract against the spot price, excluding the last few days before each expiry (where extremely short time-to-maturity can magnify rounding errors into false spikes); constructing a contract-by-contract series sharpens the exact numbers but doesn’t change the conclusions. The relationship between flows and shorts is a strong correlation, not proof of one causing the other—the point is they are two halves of the same trade. The futures short number is an upper bound on the proportion of ETF buying that is hedged, because some shorting hedges coins held elsewhere.
None of this changes the backbone. Week-to-week, Bitcoin ETF “demand” is primarily a hidden interest-rate trade, not conviction—the flow number measures the activity of participating in arbitrage far more accurately than it measures belief. And the real buying power is genuine, patient, and now by far the majority, because the “borrowed” part has spent two years going home.